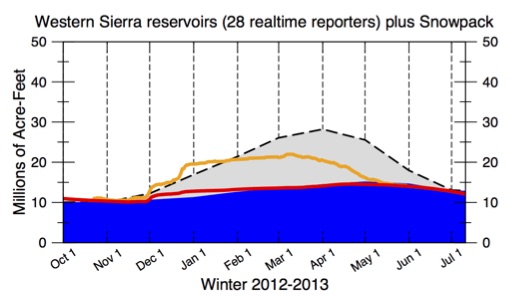
Mike Dettinger tracks water storage in the Sierra Nevada, in real time, by combining daily storage updates from 28 reservoirs (red dots on the map to the right) with snow-pack totals for the Sierra. Understanding the combination of storage in snow-pack and reservoir is important, because snow-pack acts as a natural reservoir in CA that holds water during the cooler months and releases it in the warmer drier months. Monitoring the timing of changes in the snow-pack and reservoir levels provides not only a more holistic water supply understanding, but also provides information on how droughts, storms, management, and climate change impact water availability in CA (Dettinger and Anderson, 2015 or expanded tumblr version–a few more details). In the figure the blue shaded region is the average reservoir storage of the 28 reservoirs from 2000-2015 and the grey is the average snow-pack over the same time period. The red curve is the current reservoir storage and the orange line is the current sum of reservoir plus snow-pack storage as reported by the State.
Below are the same observations, except that they have been split out into three subregions (indicated by the dots in the inset map).

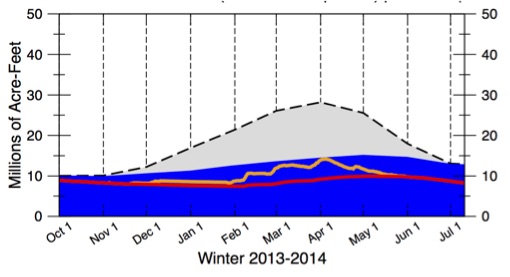
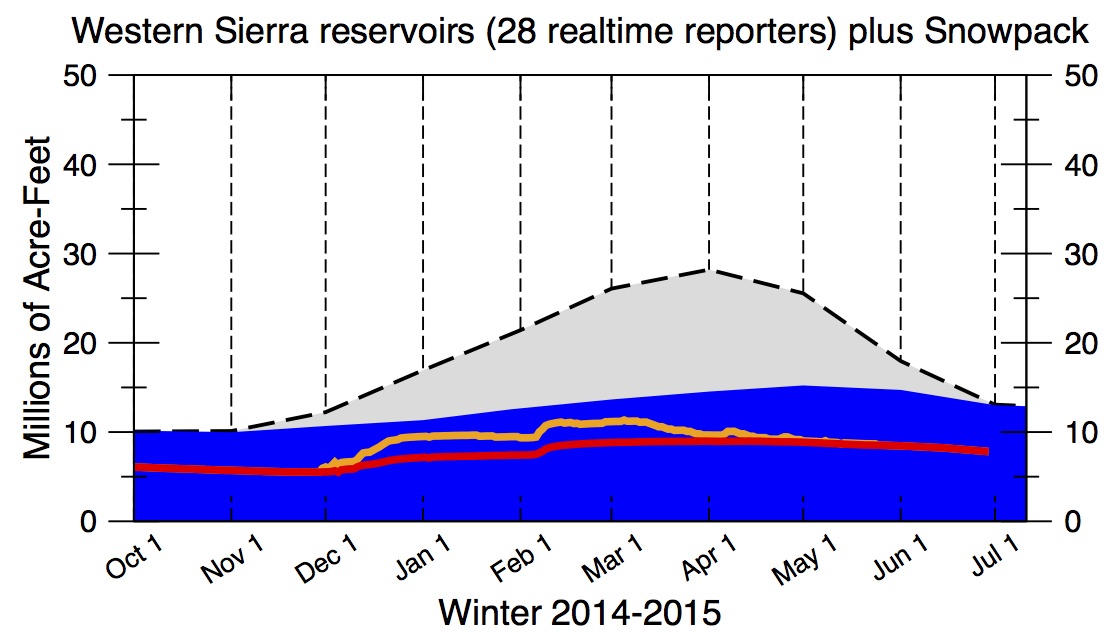
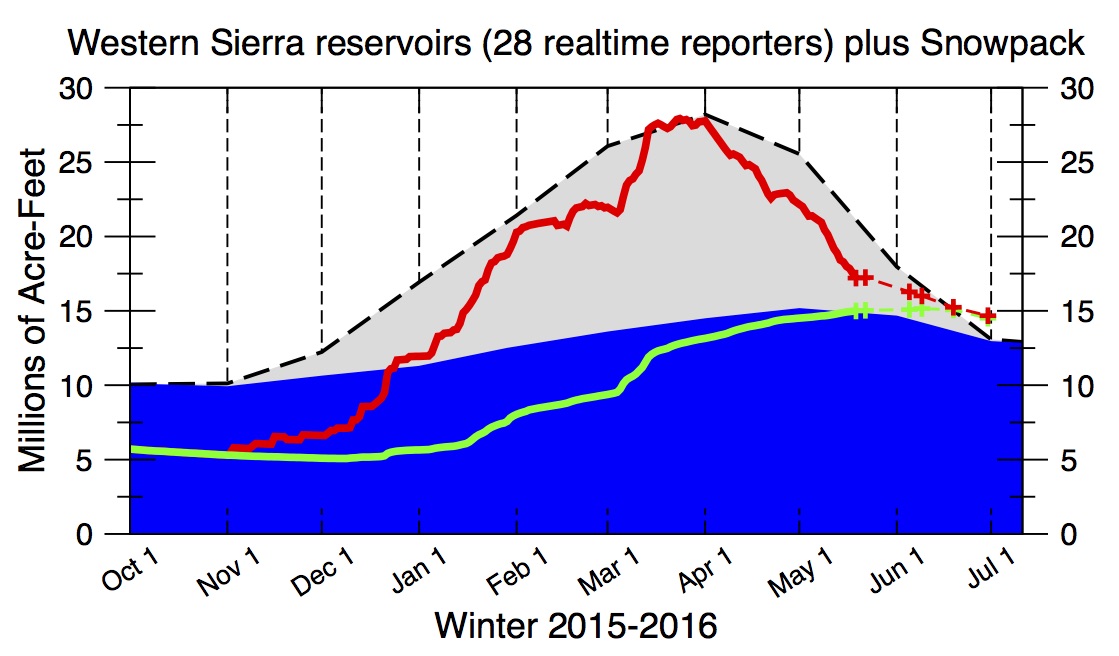
For comparison’s sake, here is how the equivalent whole-Sierra figure played out during the past 10 years.