
Updated 04/12/2023
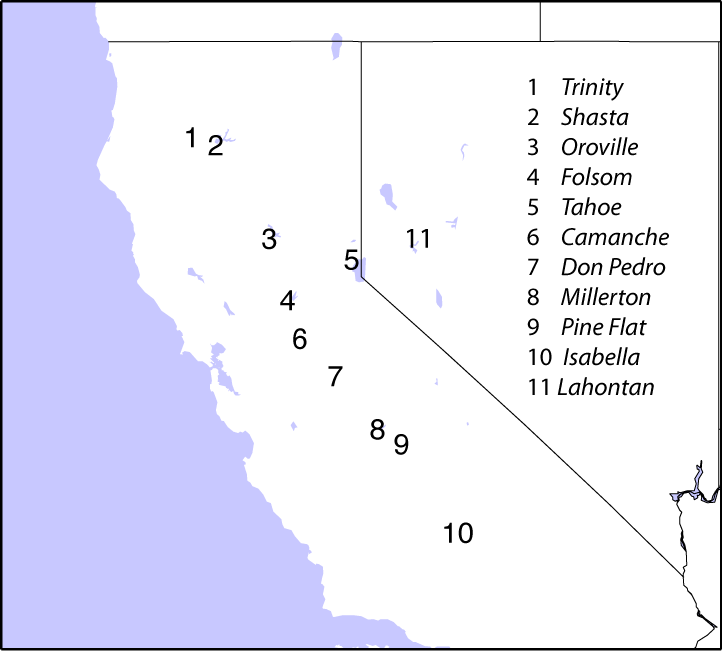
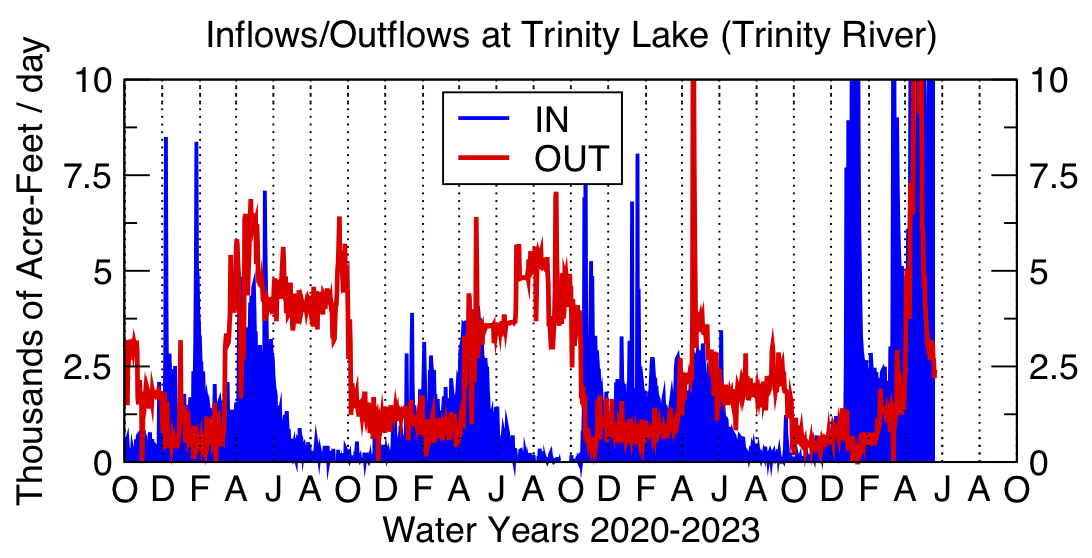
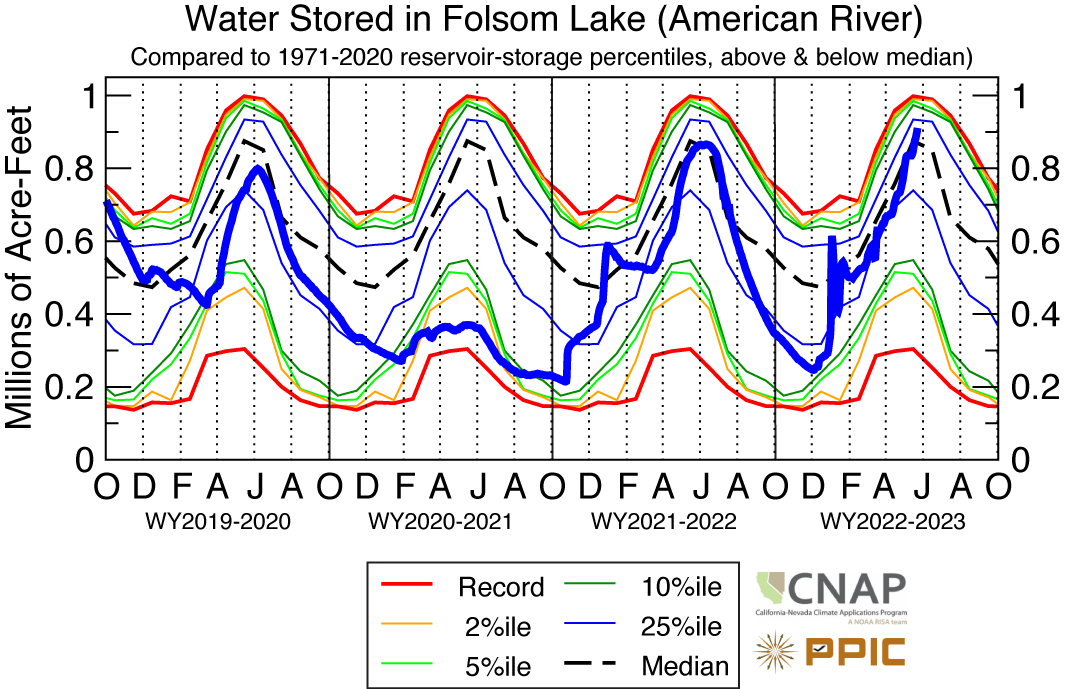
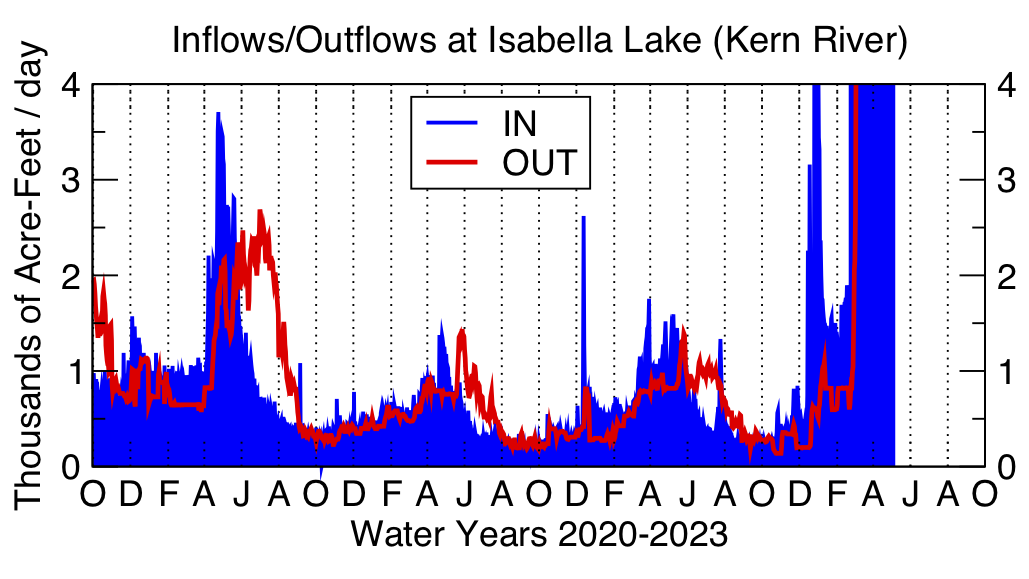
The following time series plots show the progress of the 2020-2022 California-Nevada drought as represented in some major reservoirs in terms of their daily storage amounts (overlain on long-term historical storage percentiles), along with the inflows and outflows that explain those storage changes. Also included are corresponding plots for the 2012-2015 drought. All data shown here is from the California Data Exchange Center or USGS NWIS.
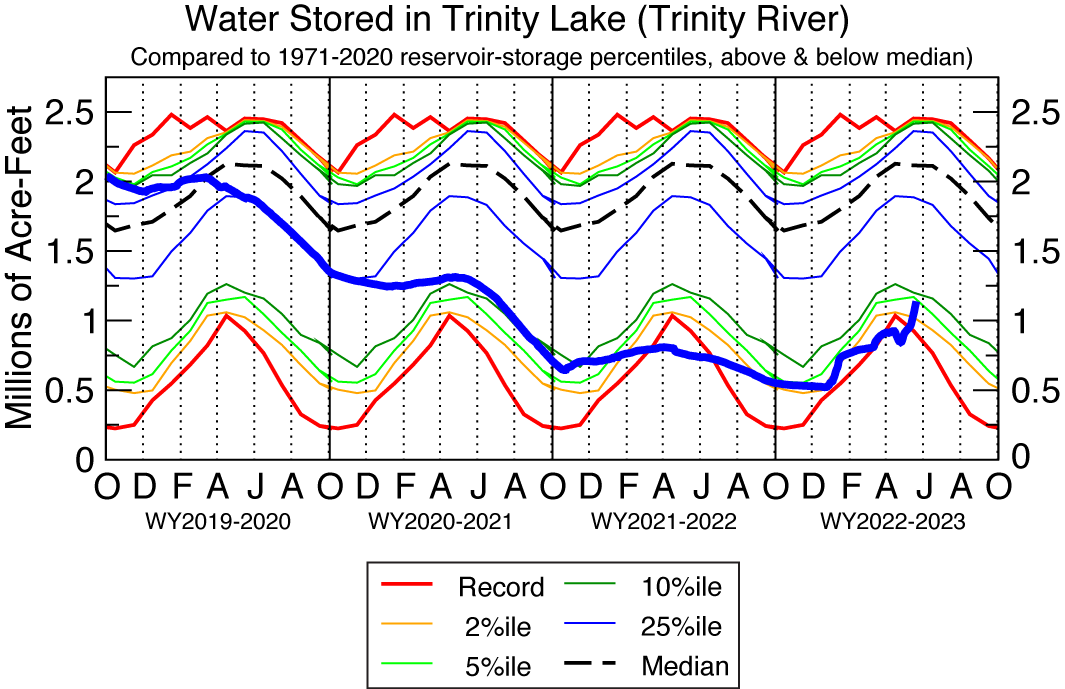
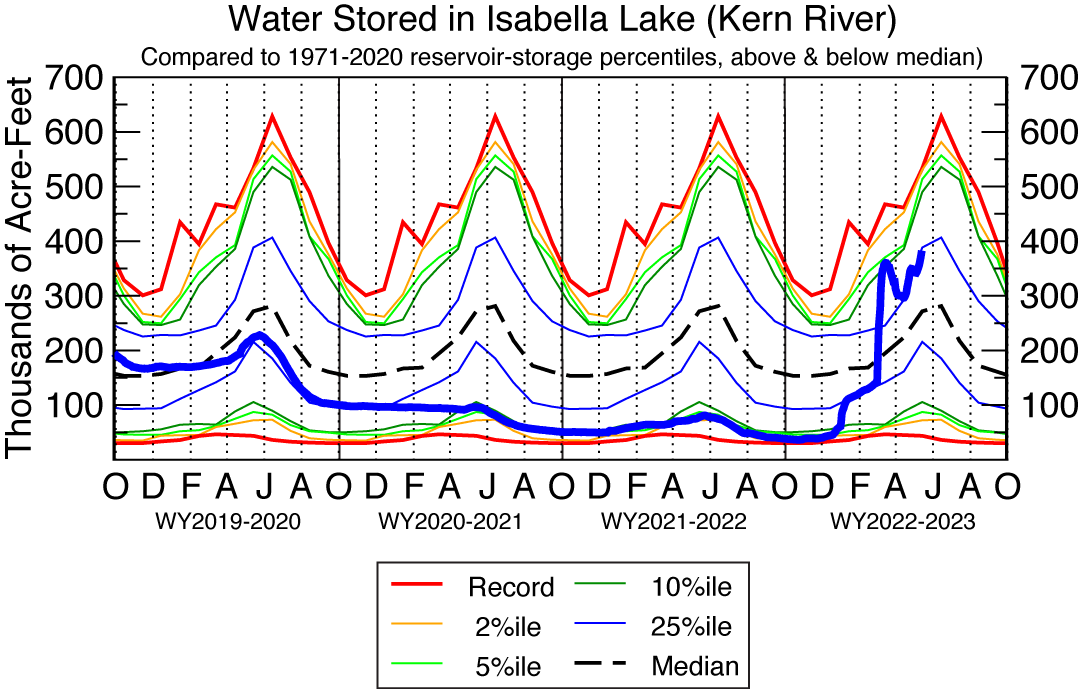
Notice the rapid transition from reservoir storages near their upper historical limits at the beginning of water-yr 2020 to progressive declines that place some of the reservoirs near or at their historical lower limits now.
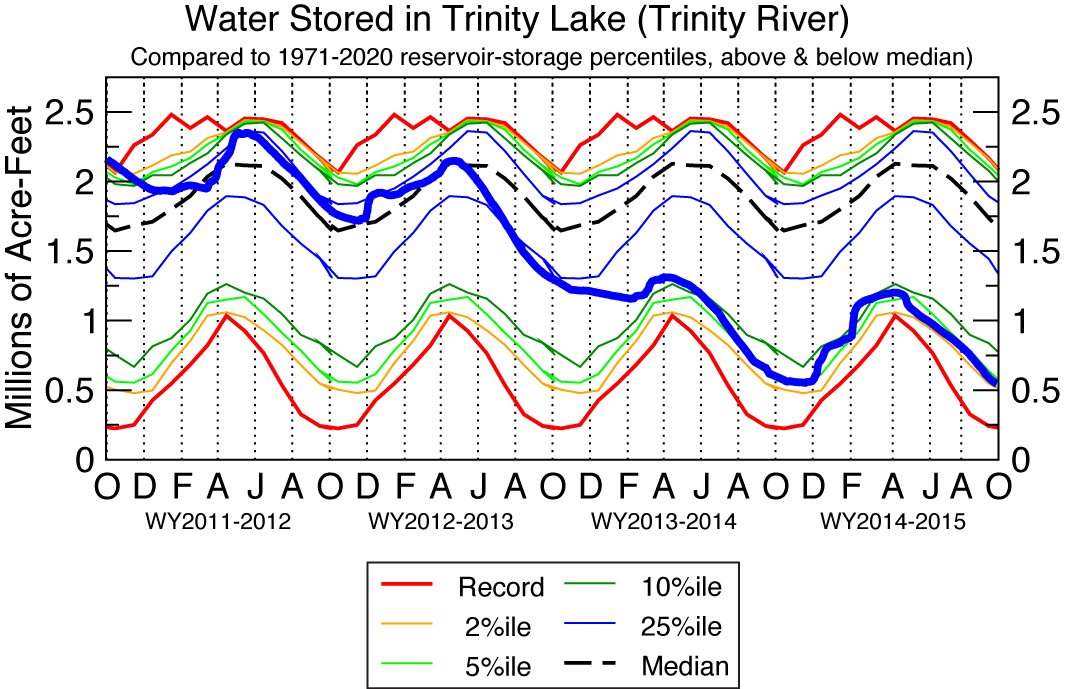
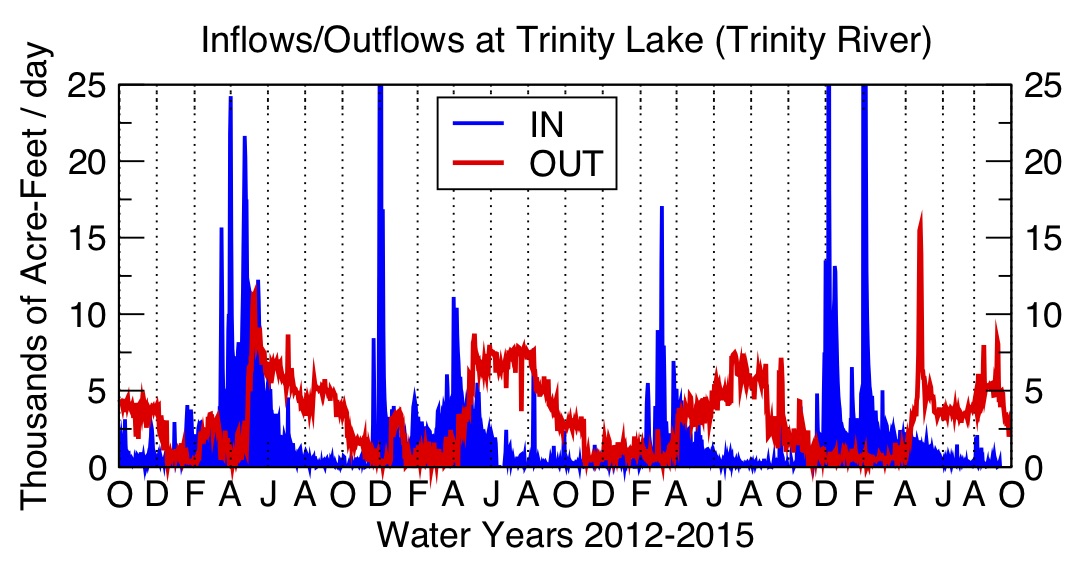
1. Trinity Lake
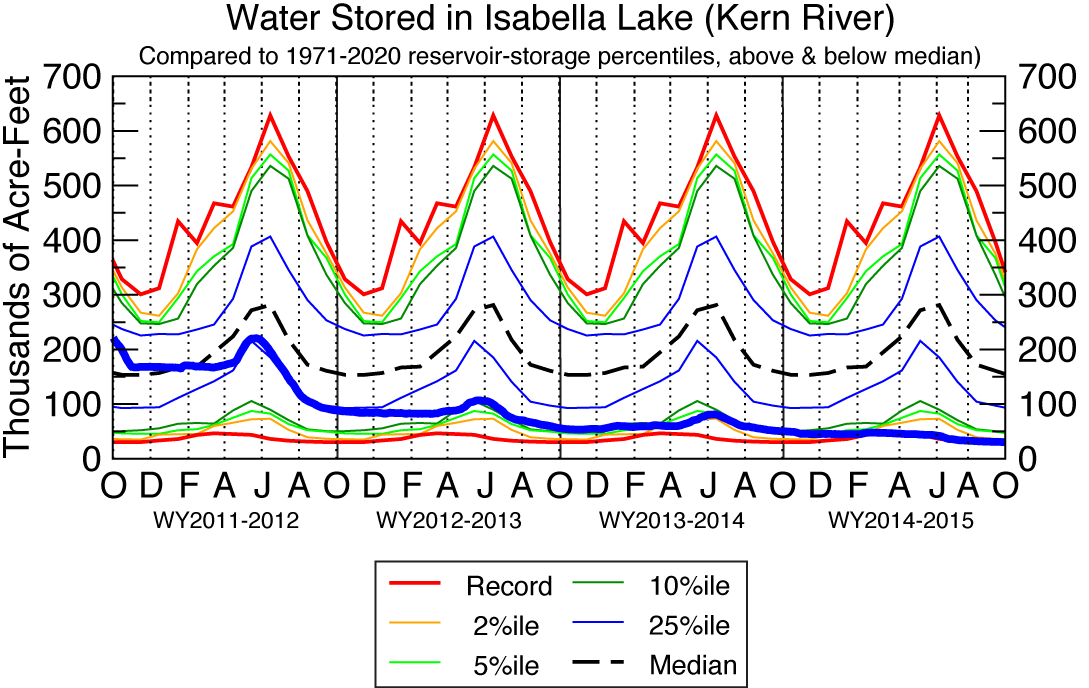
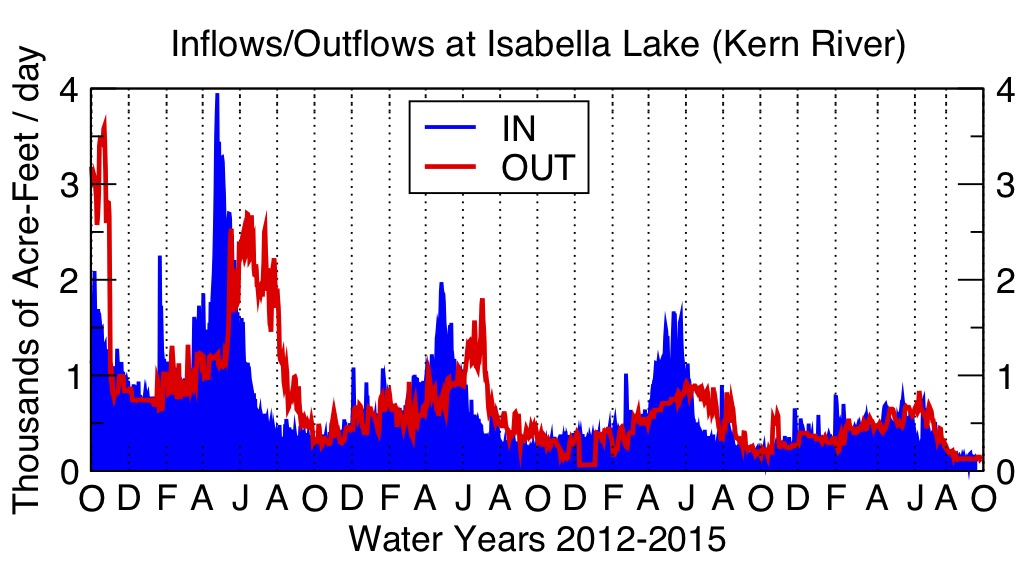
For comparison to 2012-2015 drought:
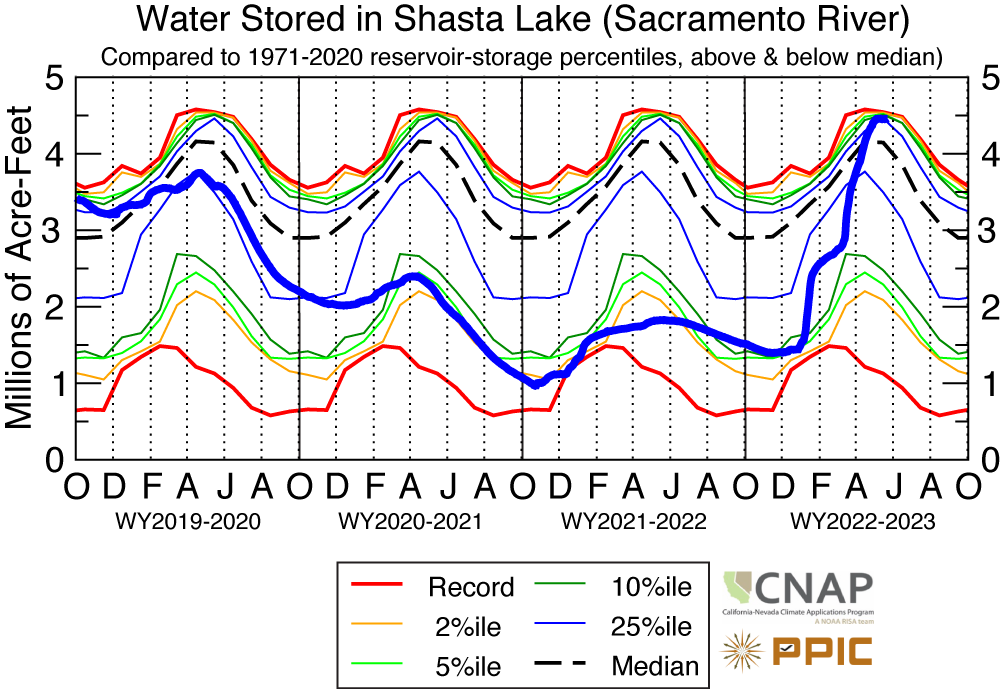
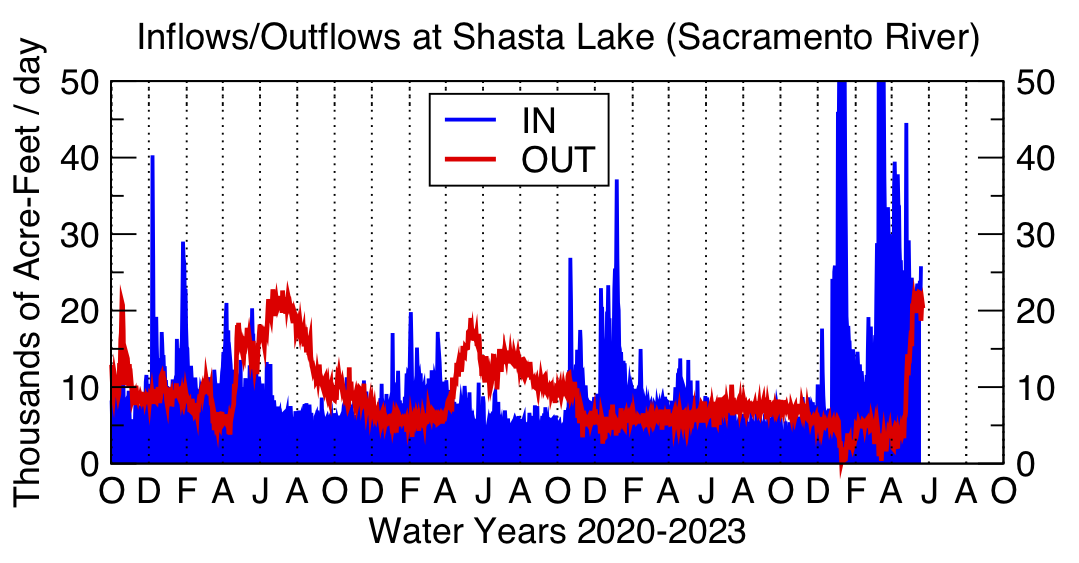
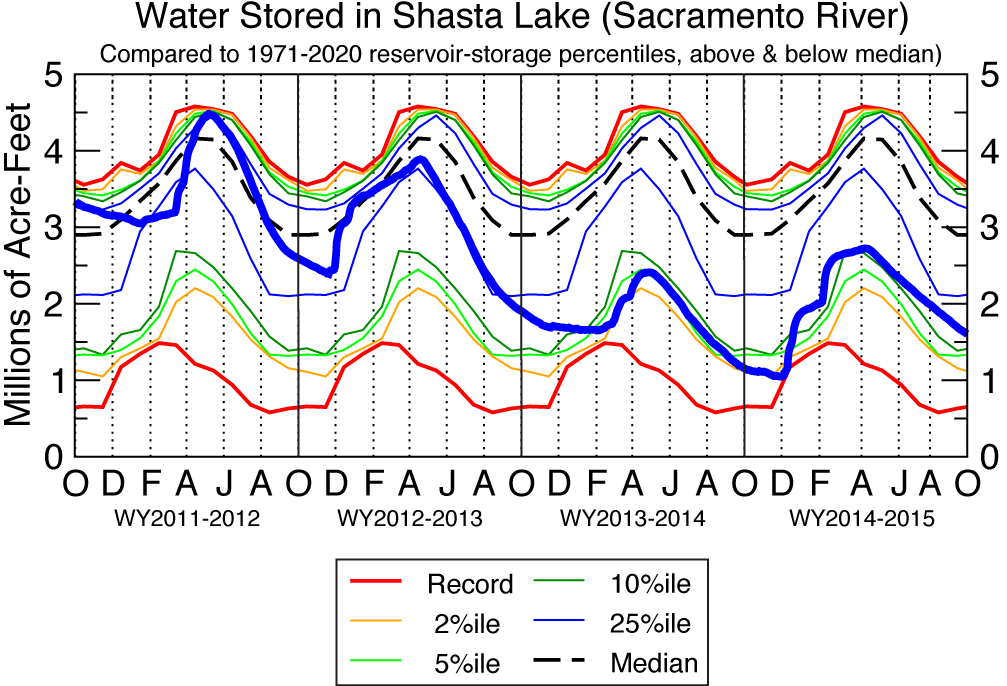
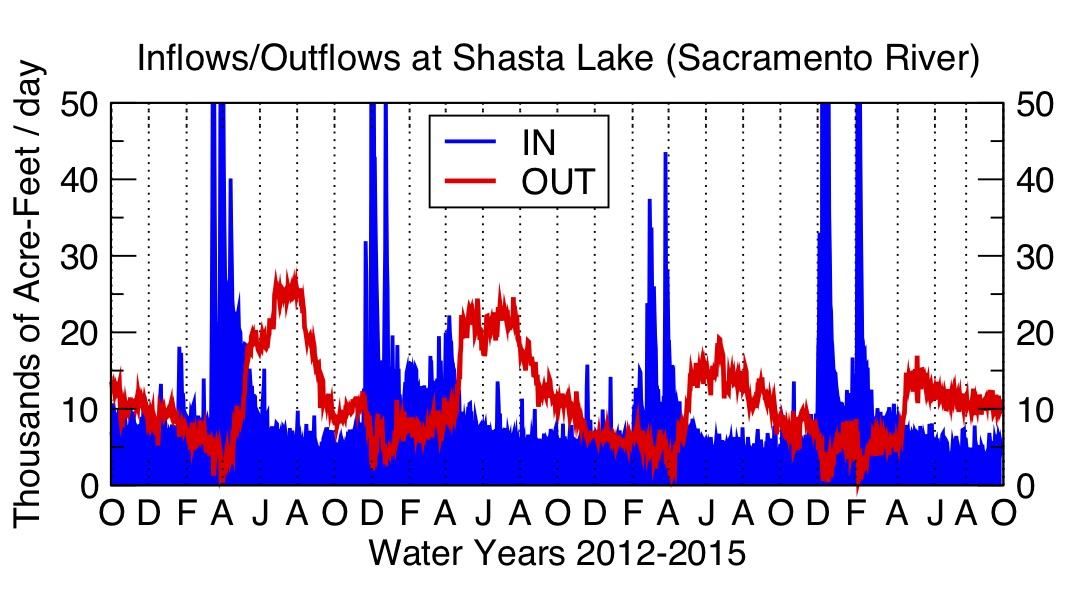
2. Shasta Lake
For comparison to 2012-2015 drought:
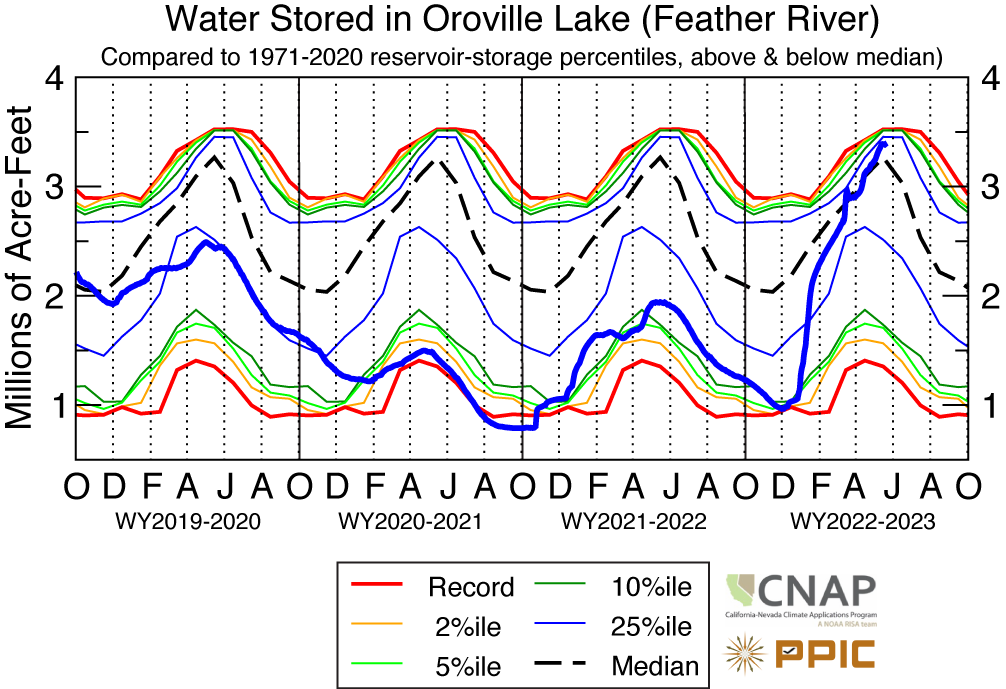
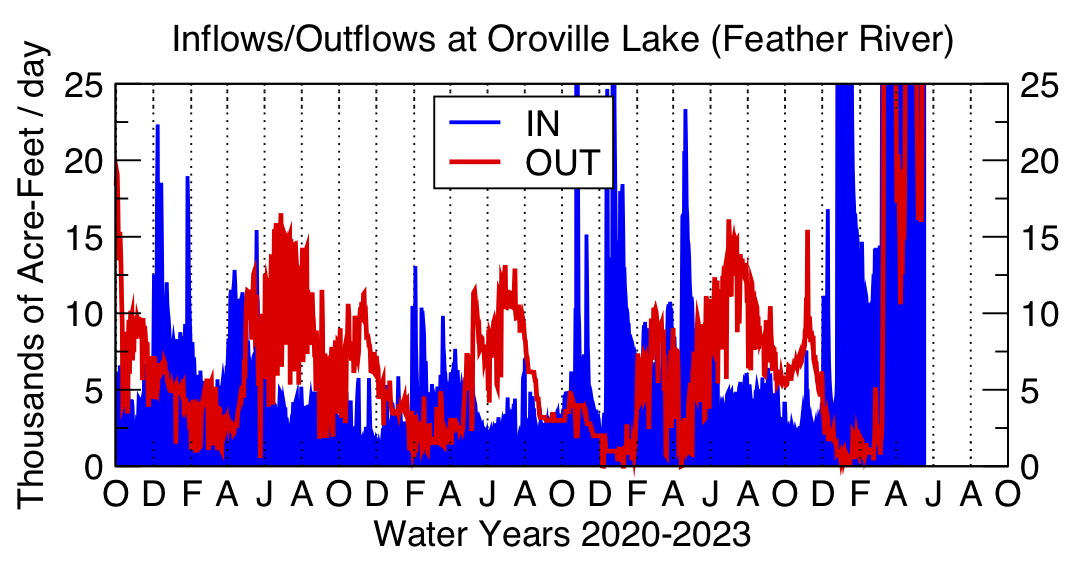
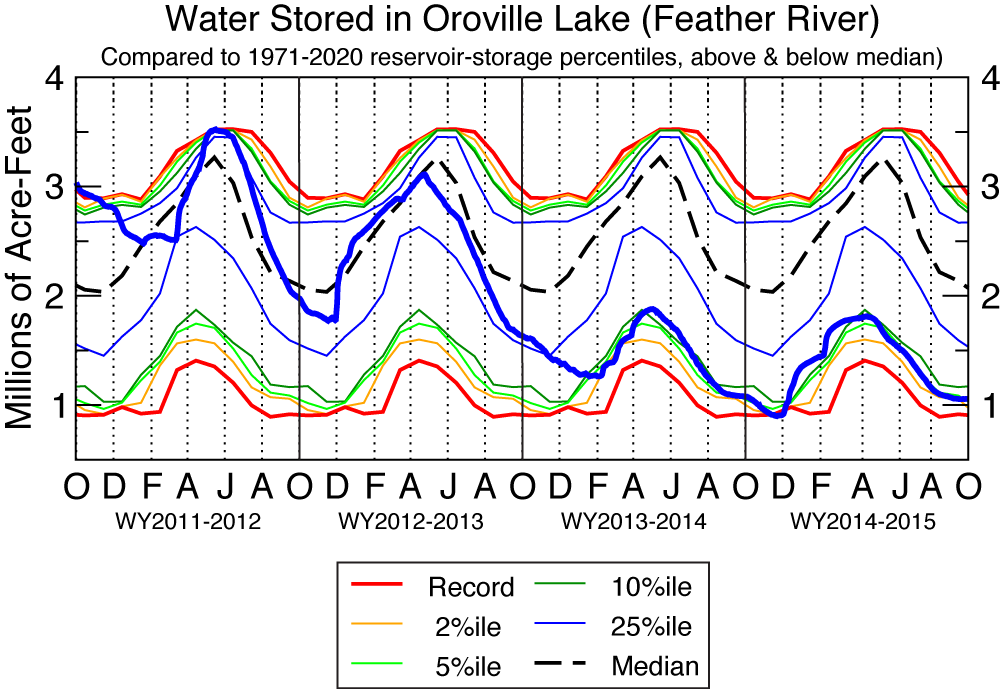
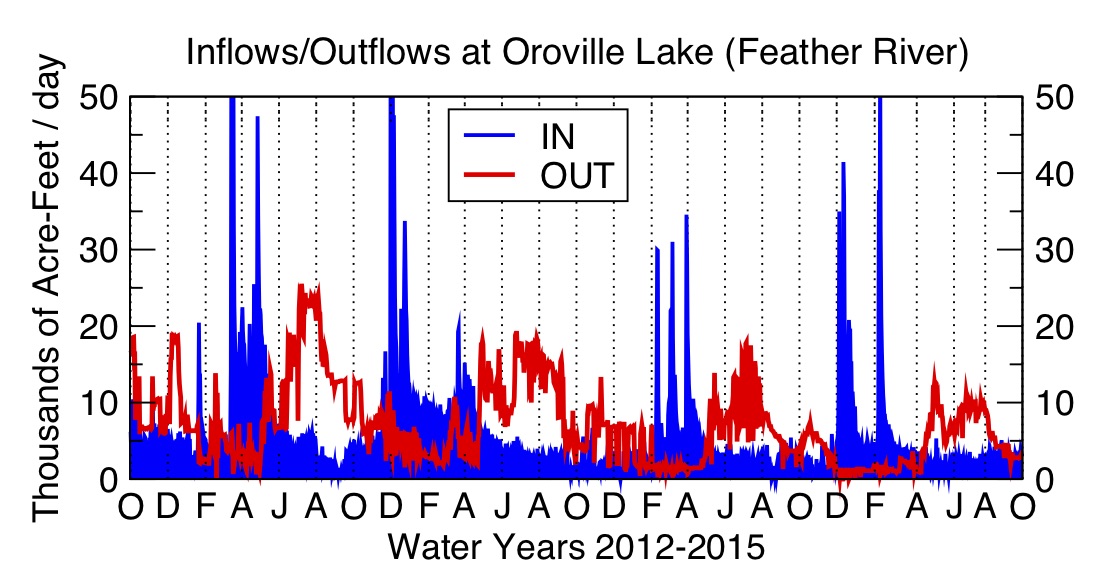
3. Oroville Lake
For comparison to 2012-2015 drought:
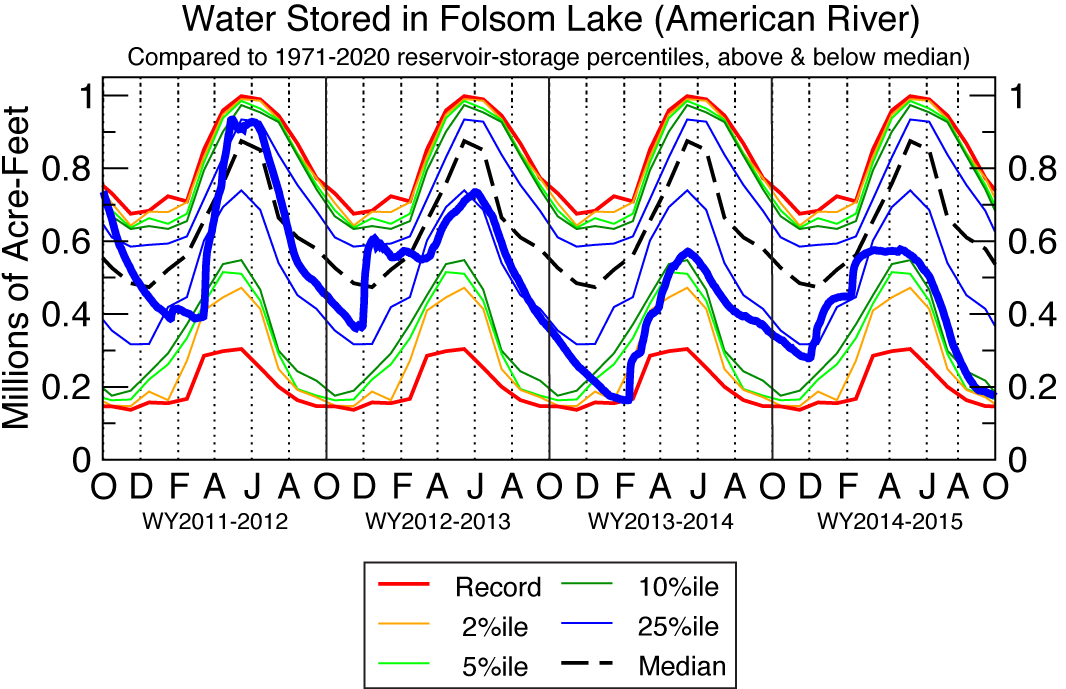
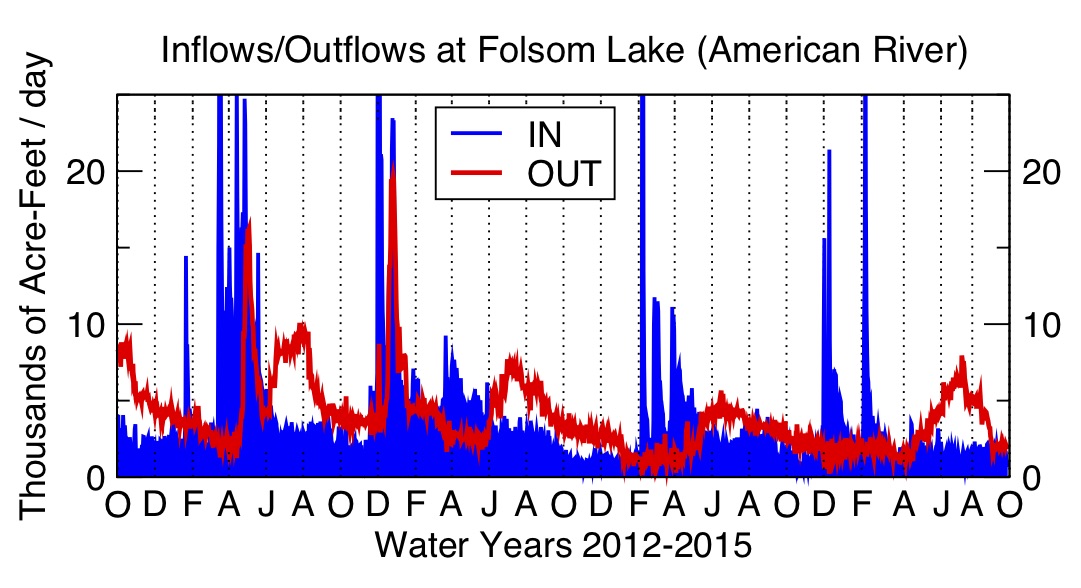
4. Folsom Lake

For comparison to 2012-2015 drought:
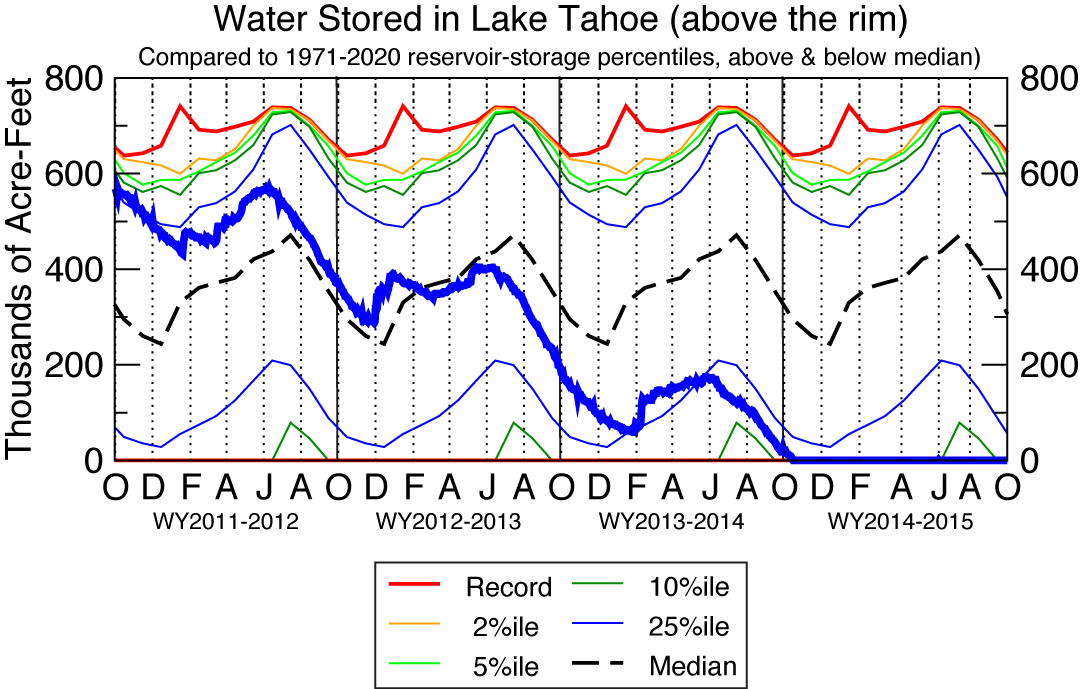
5. Lake Tahoe
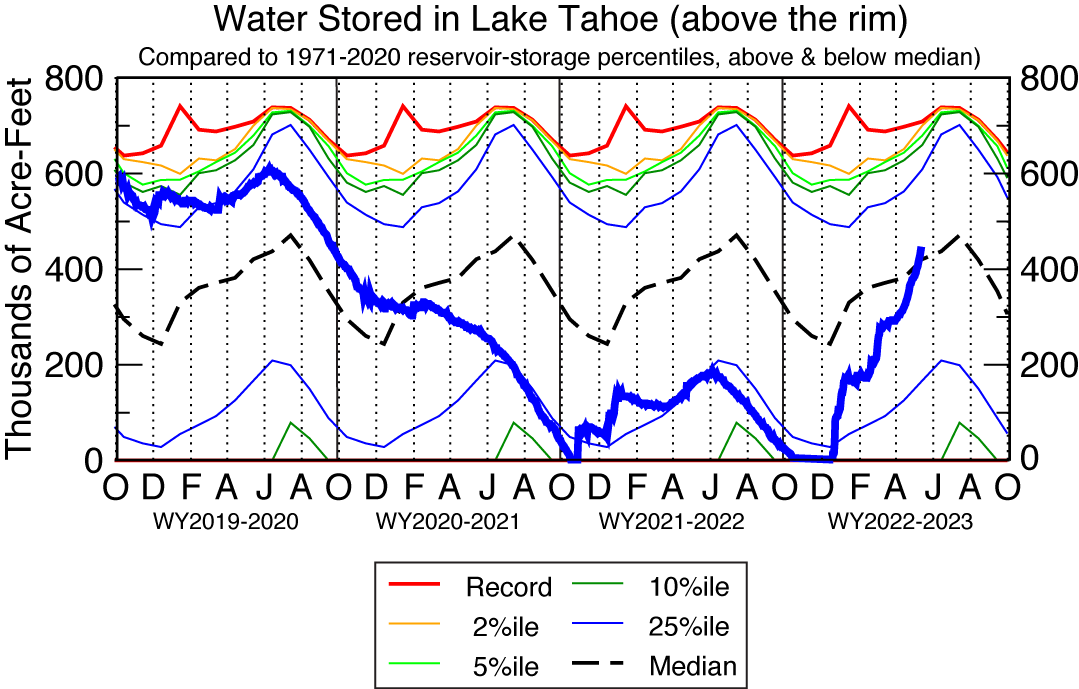
Note: Lake Tahoe is surrounded by dozens of inflowing catchments, many ungaged, so that–unlike the other reservoirs here–showing an inflow-outflow plot is impractical.
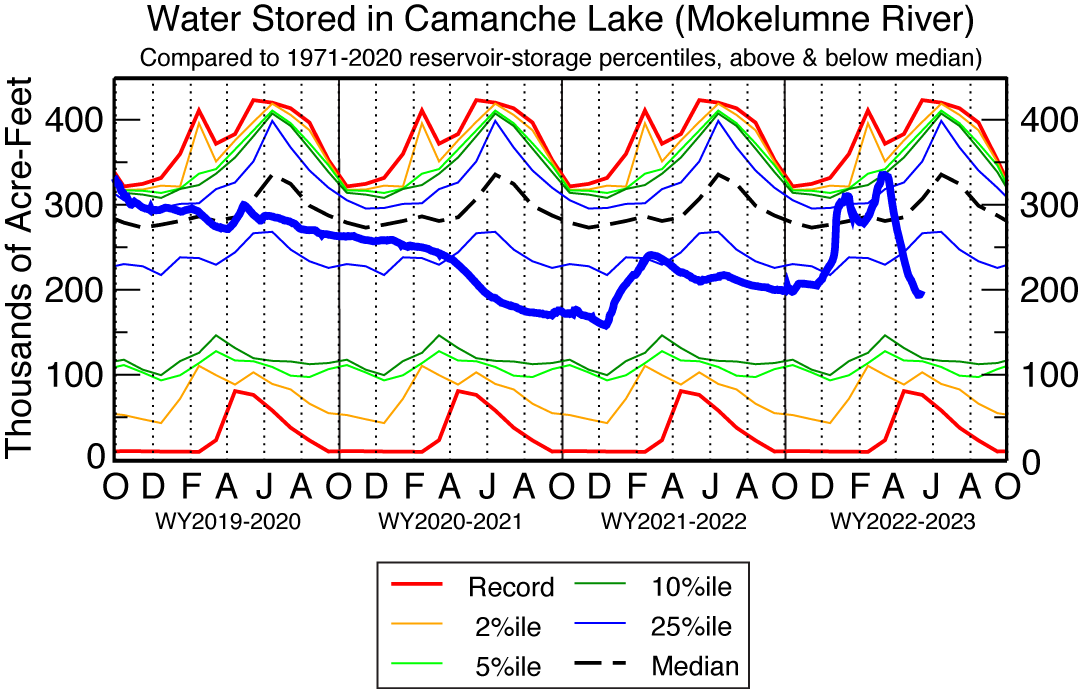
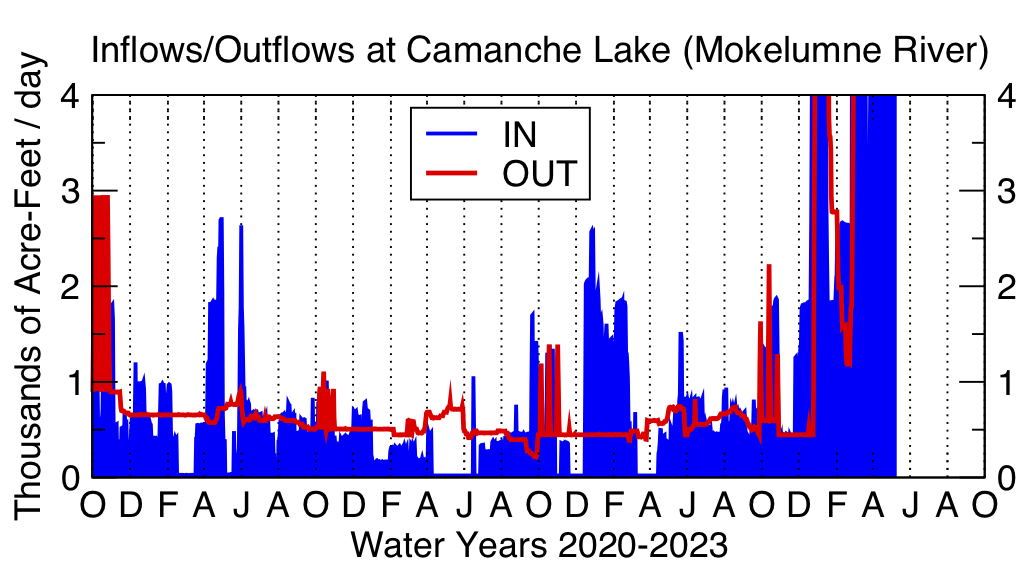
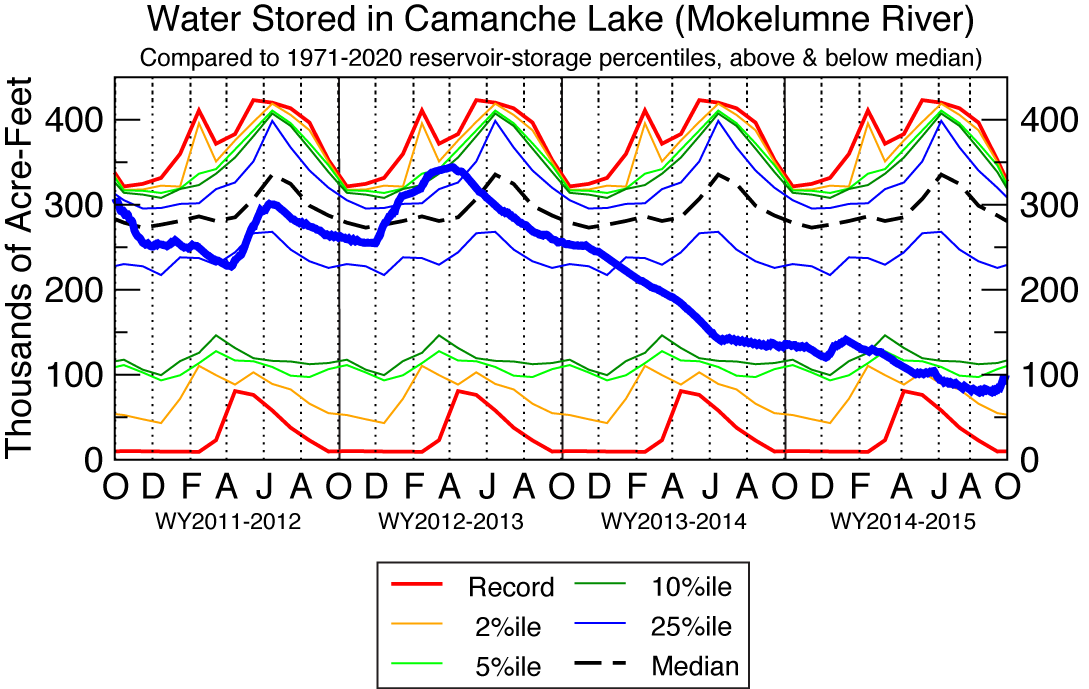
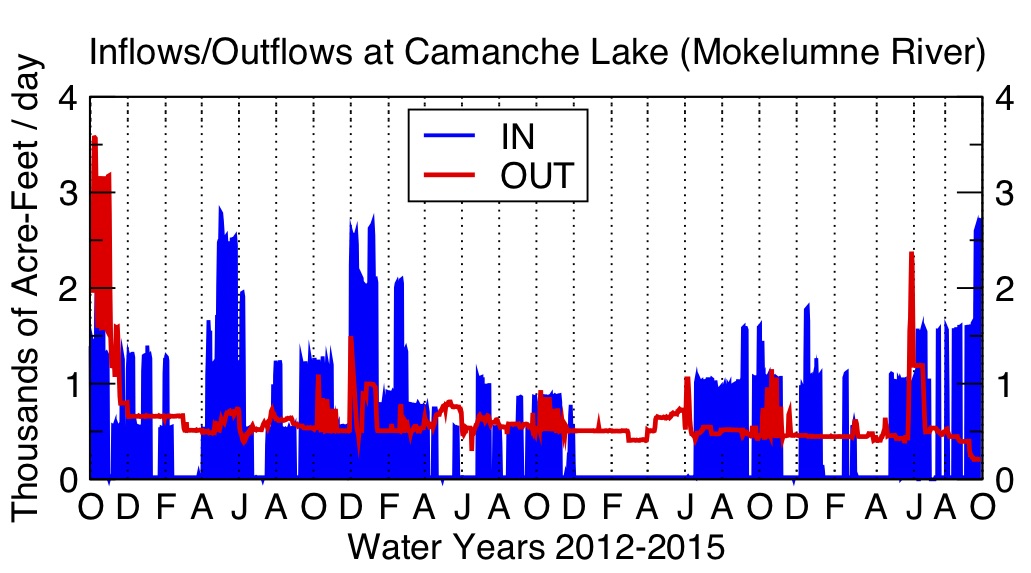
6. Camanche Lake
For comparison to 2012-2015 drought:
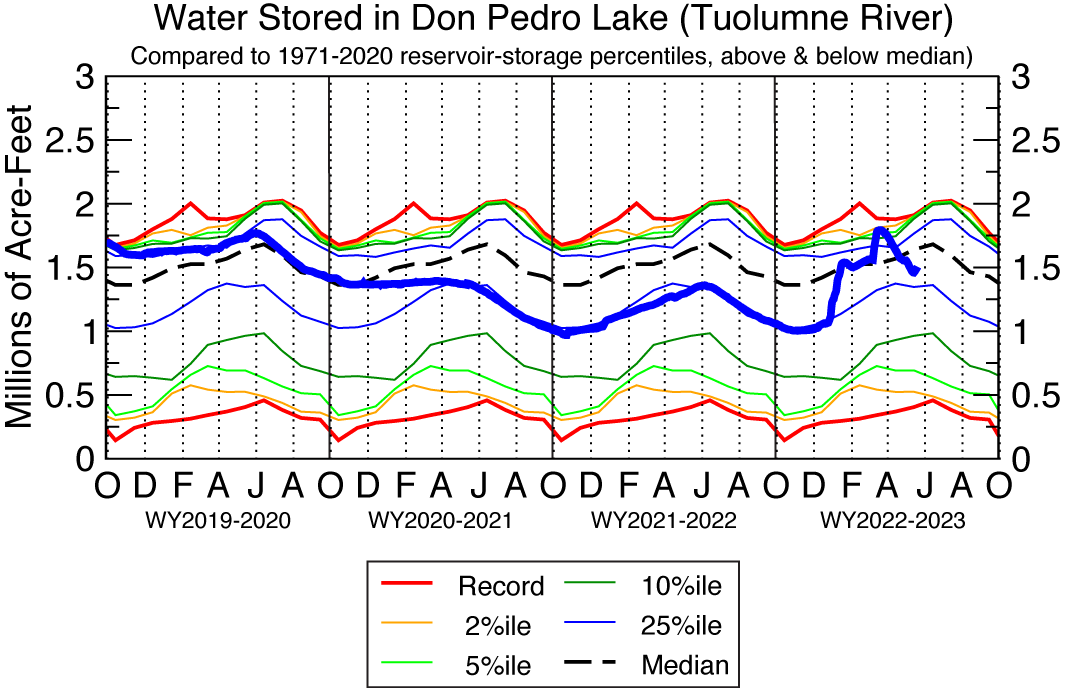
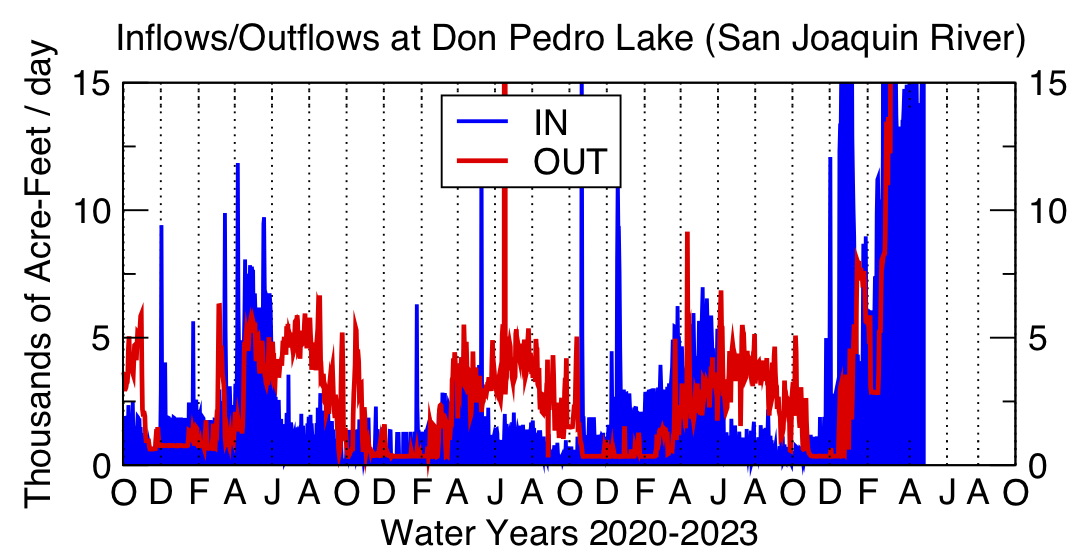
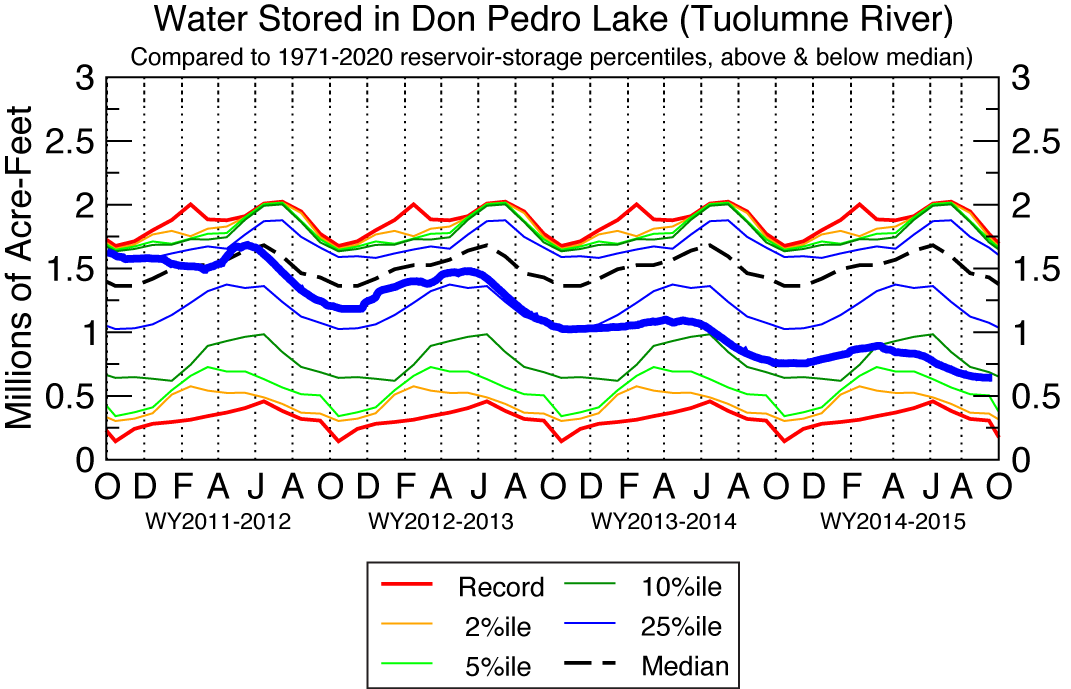
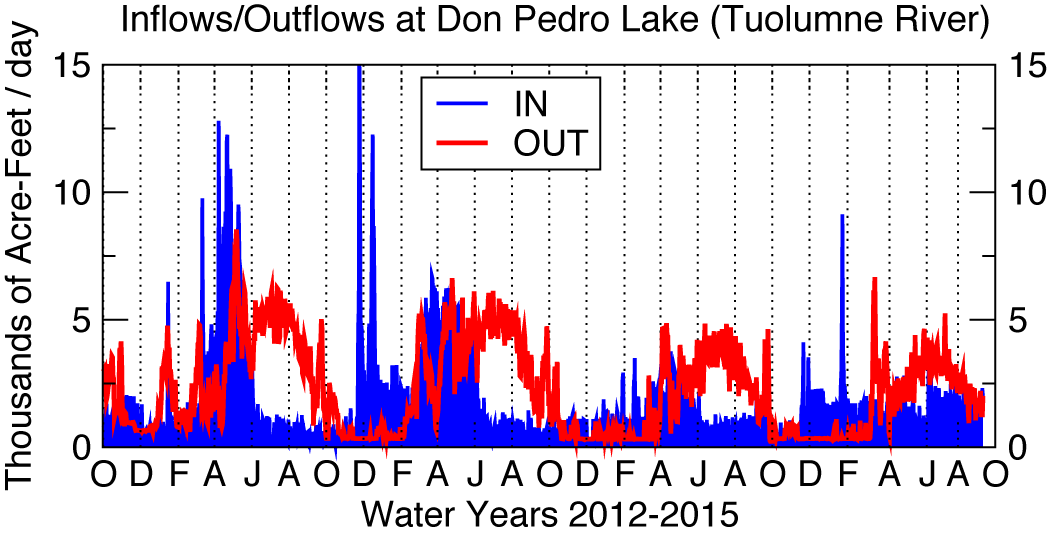
7. Don Pedro Lake
For comparison to 2012-2015 drought:
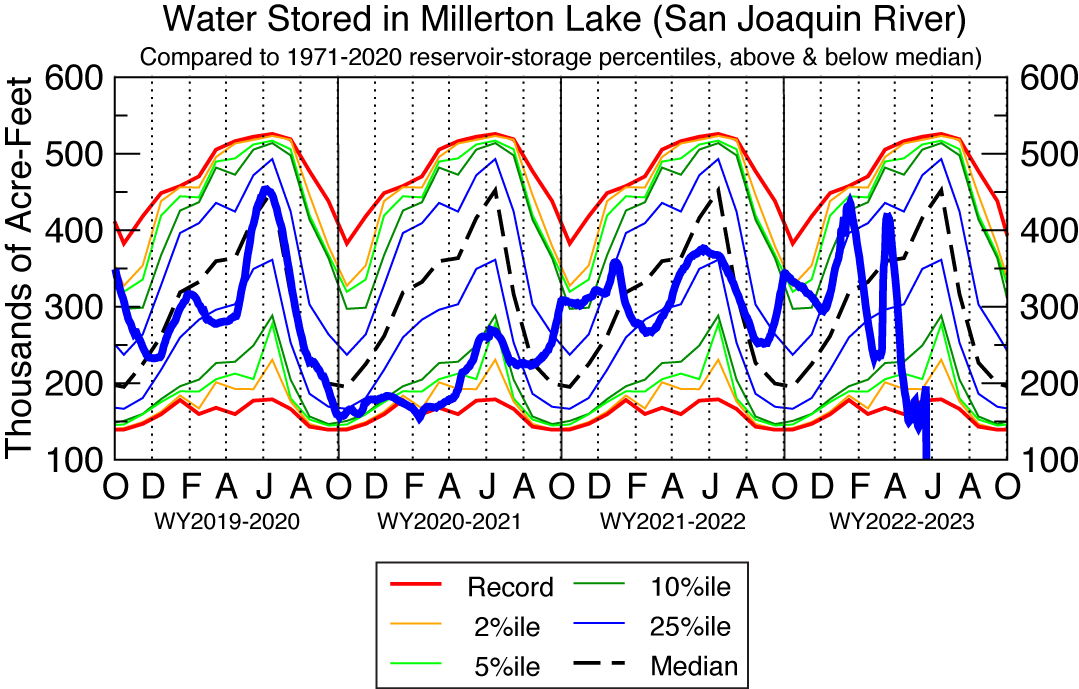
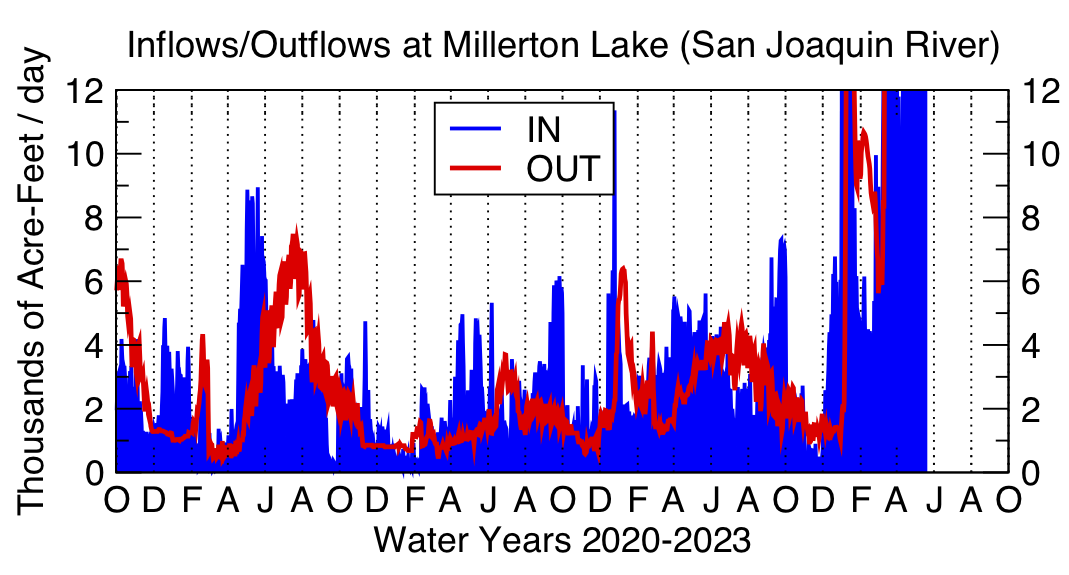
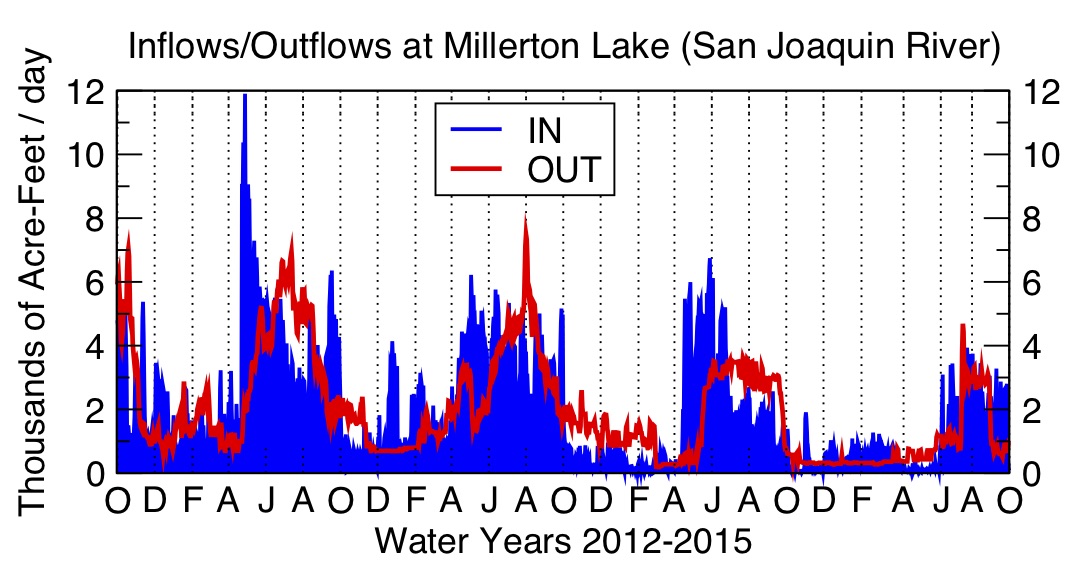
8. Millerton Lake
For comparison to 2012-2015 drought:

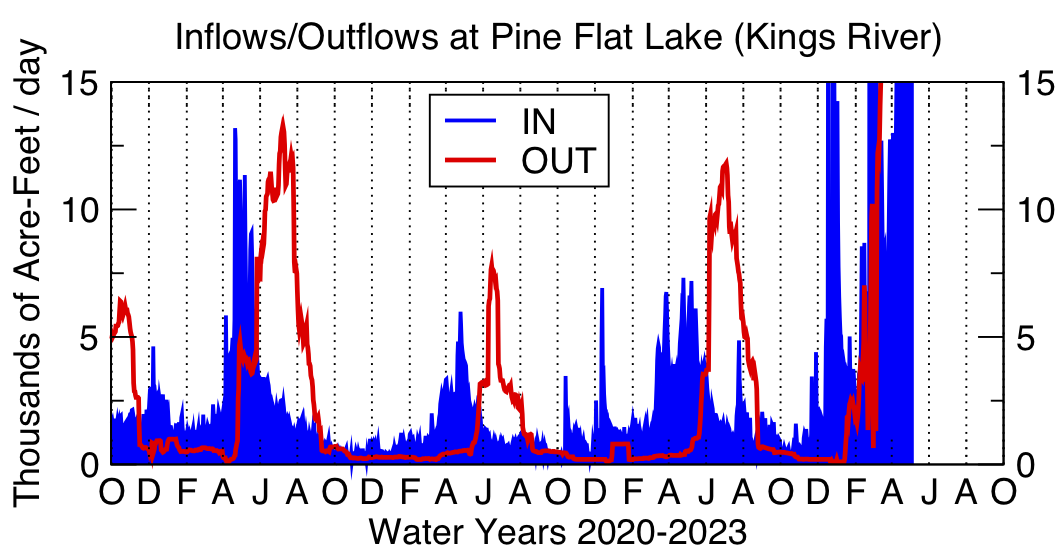
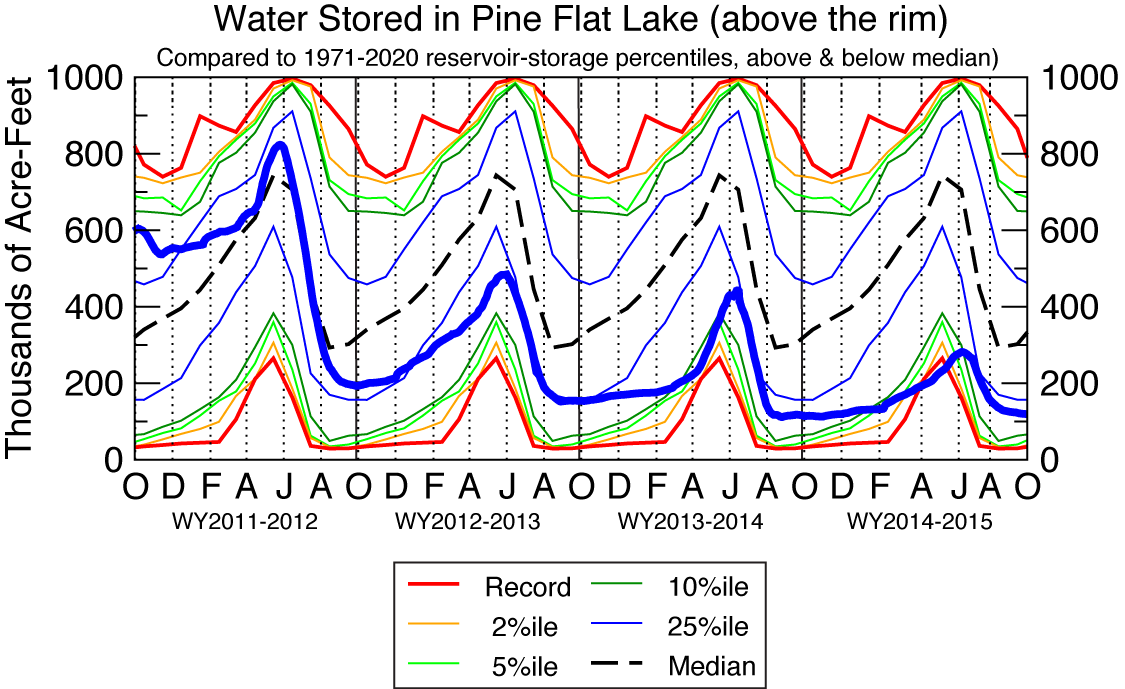
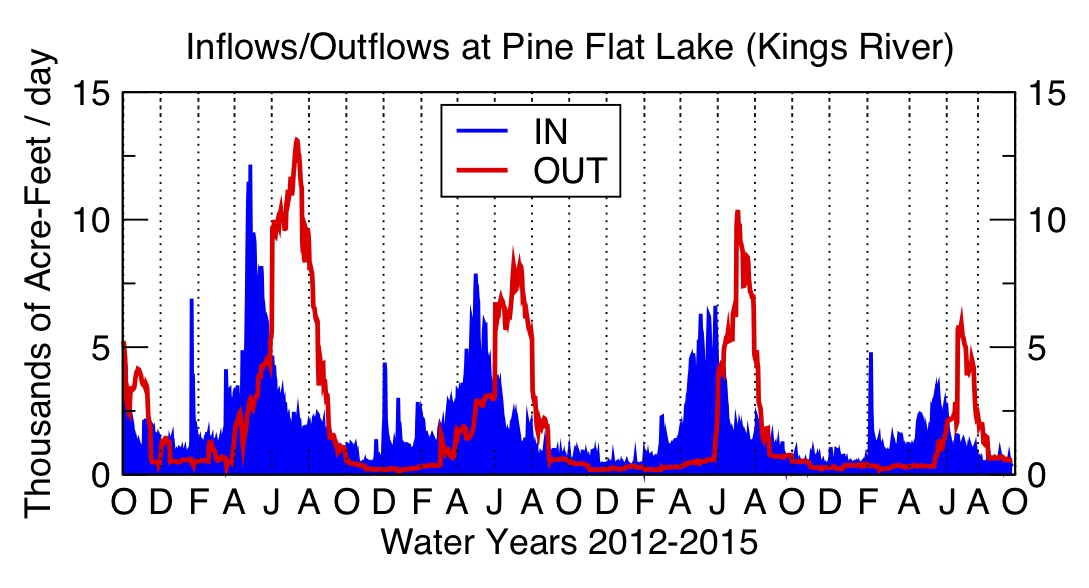
9. Pine Flat Lake

For comparison to 2012-2015 drought:
10. Isabella Lake
For comparison to 2012-2015 drought:
11. Lake Lahontan, NV
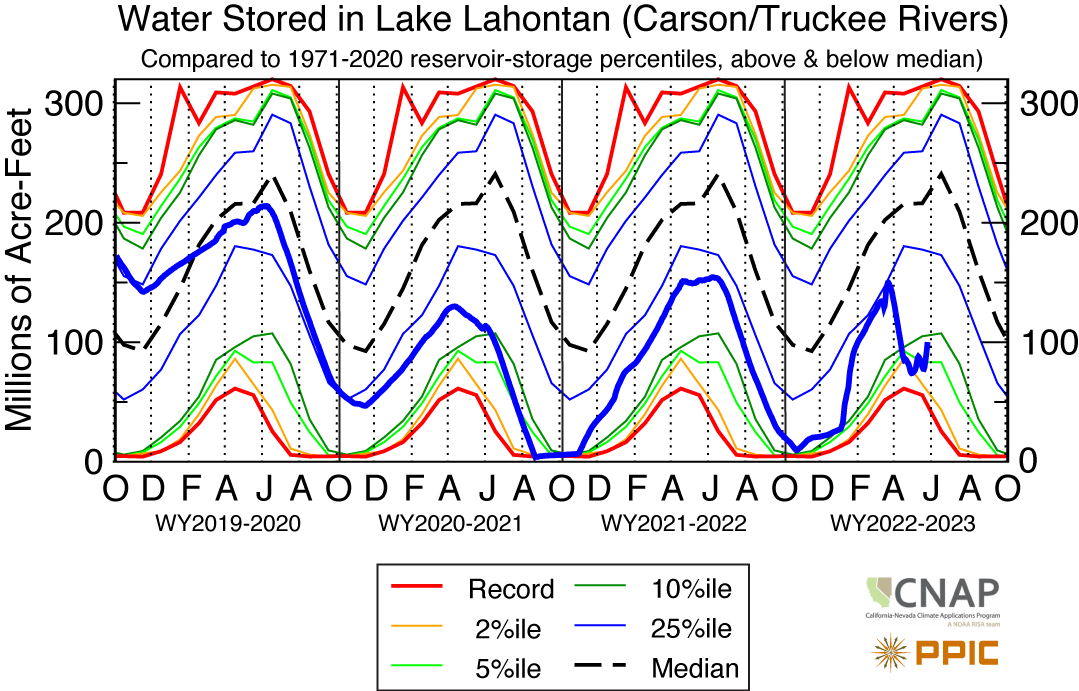
For comparison to 2012-2015 drought:
