Mountain snowpacks provide an “extra” form of water storage in California and across the Western US, acting as natural reservoirs that hold winter precipitation (as snow) from the cold wet season for release as snowmelt in the warm dry seasons when water demands for human and environmental uses, including irrigation, are high. The combination of water stored as snow and water stored in human-built reservoirs therefore is a useful indicator of developing droughts, persistent droughts, and the termination of droughts in many water-supply systems of the western states. In a winter when reservoir storage is unusually low but snowpacks are unusually rich, it would be easy to imagine that a drought is occurring or soon to develop, if only the reservoir storage is reported. Conversely, in a winter when snowpack is lacking but reservoir storage is high (e.g., with the streamflows from a preceding wet year, like Lake Tahoe in water 2020), it is easy to anticipate that a drought is coming, if only snowpack is considered. Remarkably, in most reservoir trackers, snow and reservoirs are reported separately.
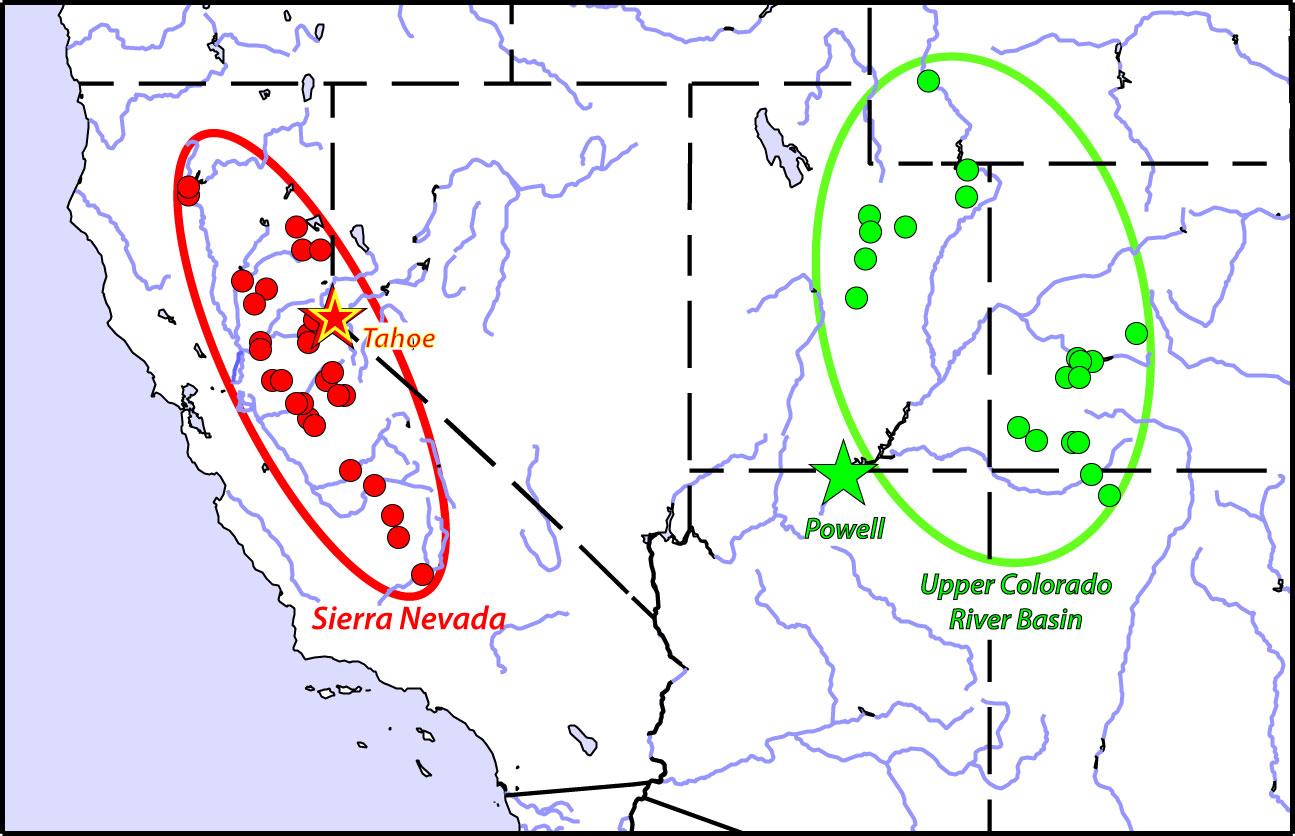
In the subsections below, we provide simple graphical summaries of the status of snow-plus-reservoir storage for the Sierra Nevada and Upper Colorado River Basin (see map at right) to facilitate tracking of the overall storage in the combination of these two “reservoir” types, to allow quick judgements regarding the status of “storage drought” (Dettinger and Anderson, 2015; or expanded version) in these two key western systems.
SIERRA NEVADA STORAGE
(updated thru 04/05/2024)
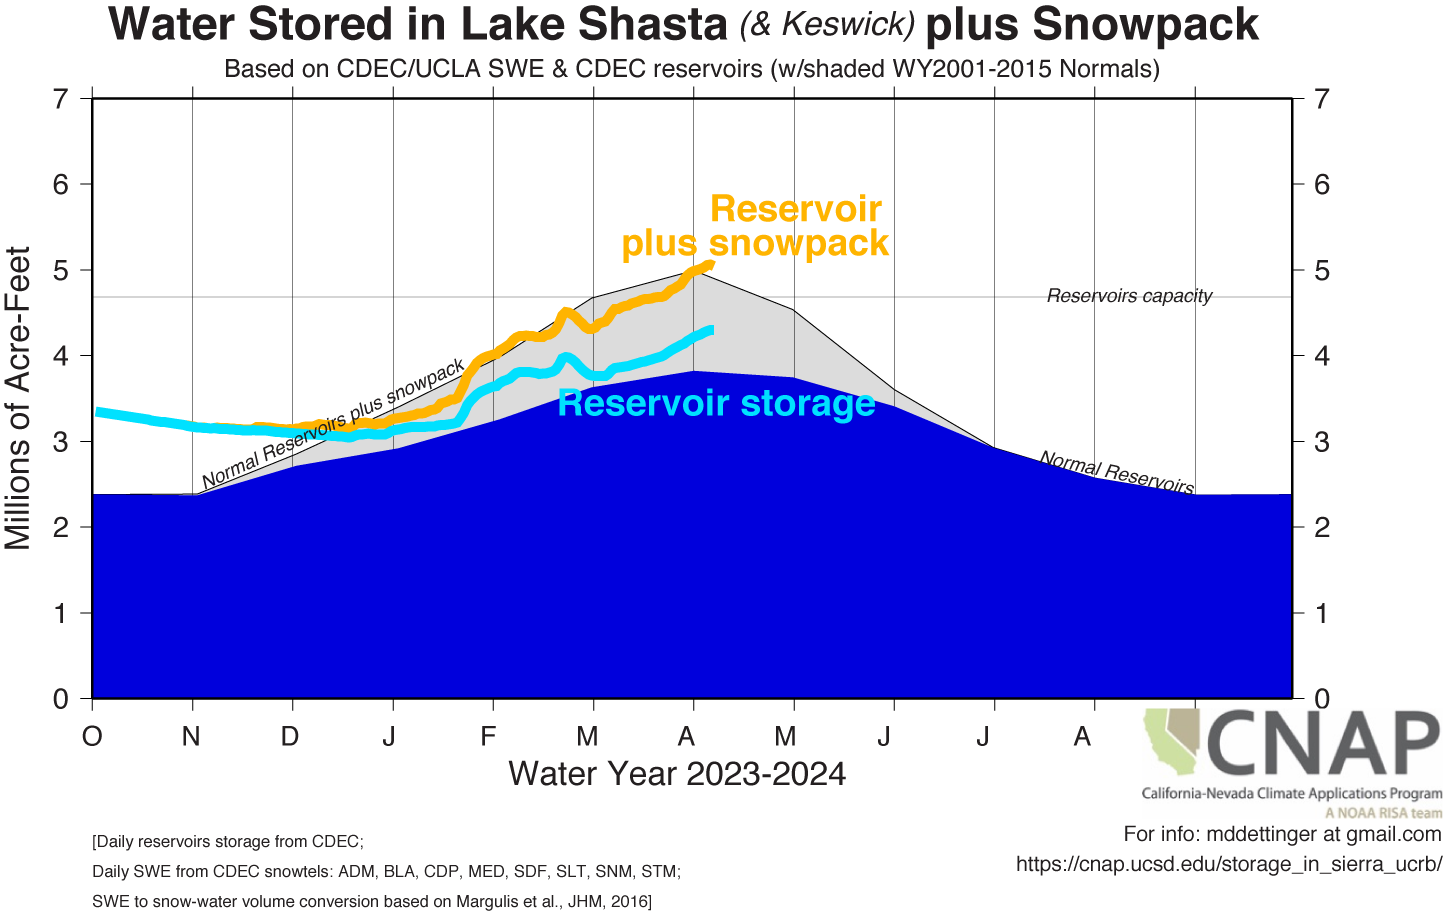
The following figure shows the most recent summary of reservoir water storage and reservoir-plus-snowpack water storage for the westward draining Sierra Nevada, based on daily California Department of Water Resources’ reports of storage in 28 reservoirs
and of state-averaged snow-water content, The former is reported in acre-feet of stored water, and the latter is reported in inches of water content (how much liquid water would be released, per unit area, by melting all the snow on the ground at a given time). This depth of snow-water content is converted to acre feet of water by a simple scaling (between state-average inches of water content and long-term average April-1 total water from the Margulis et al. (2016) snow “reanalysis” data set. Taken together, adding one to the other gives a simple status report for total water in surface storage in the mountain range.
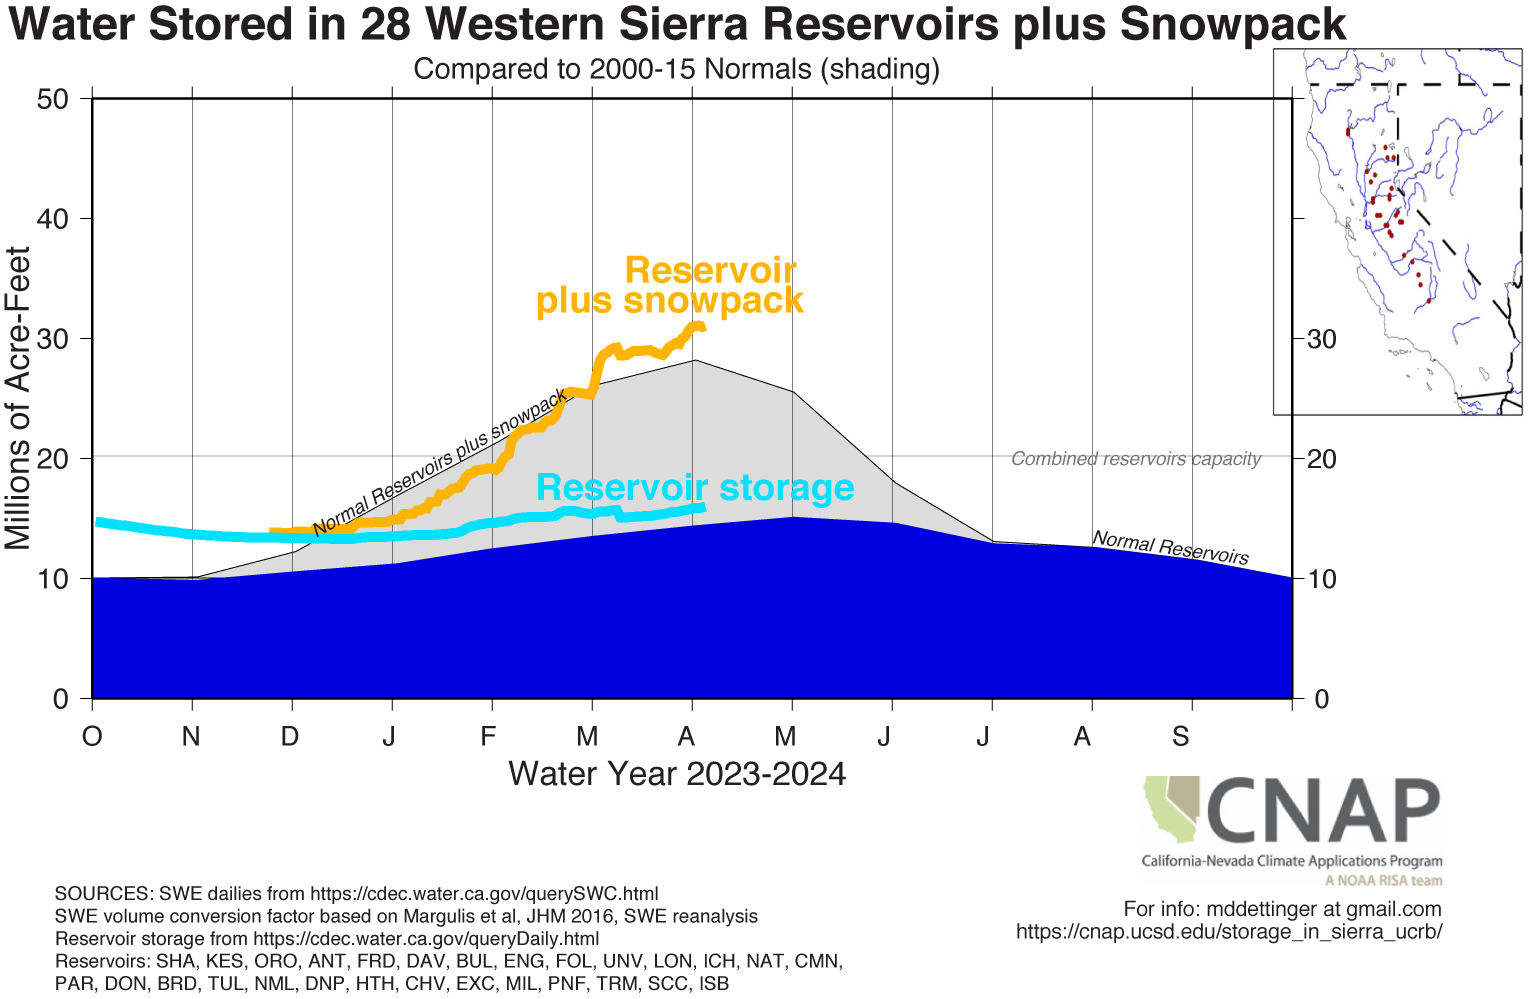
In the figure the blue shaded region is the long-term average reservoir storage of the 28 reservoirs (indicated by red symbols in the inset map of California and Nevada) from 2000-2015 and the grey is the average snow-pack over the same time period. The red curve is the current reservoir storage for the same reservoirs and the orange line is the current sum of reservoir plus snow-pack storage. A history of how these daily storage amounts have played out each water year since 2010 is available here.
In water year 2022, reservoir storage began far below normal, reflecting the two previous severe drought years. A historic string of (atmospheric river) stormas in late October yielded enough runoff to induce a minor jump in range-scale reservoir storage, but wetted soils in ways that prepared for more runoff when the next set of storms arrived. In December, more storms finally arrived and major jumps in snowpack storage occurred.
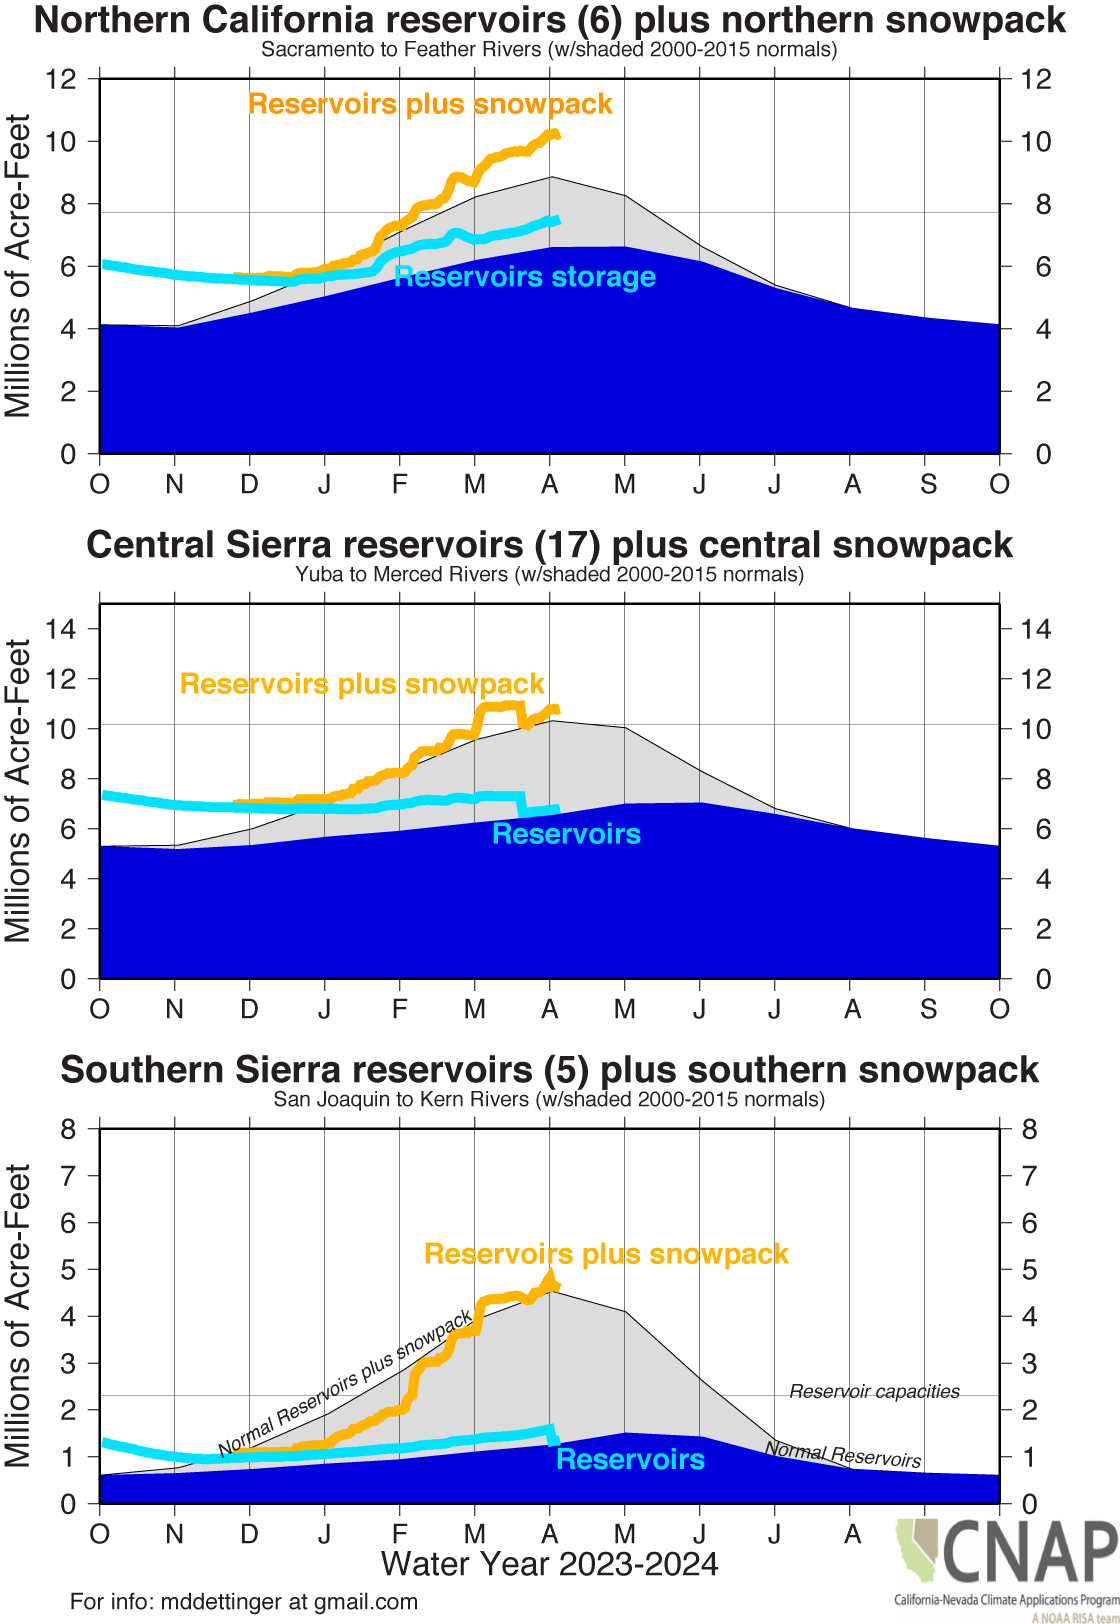
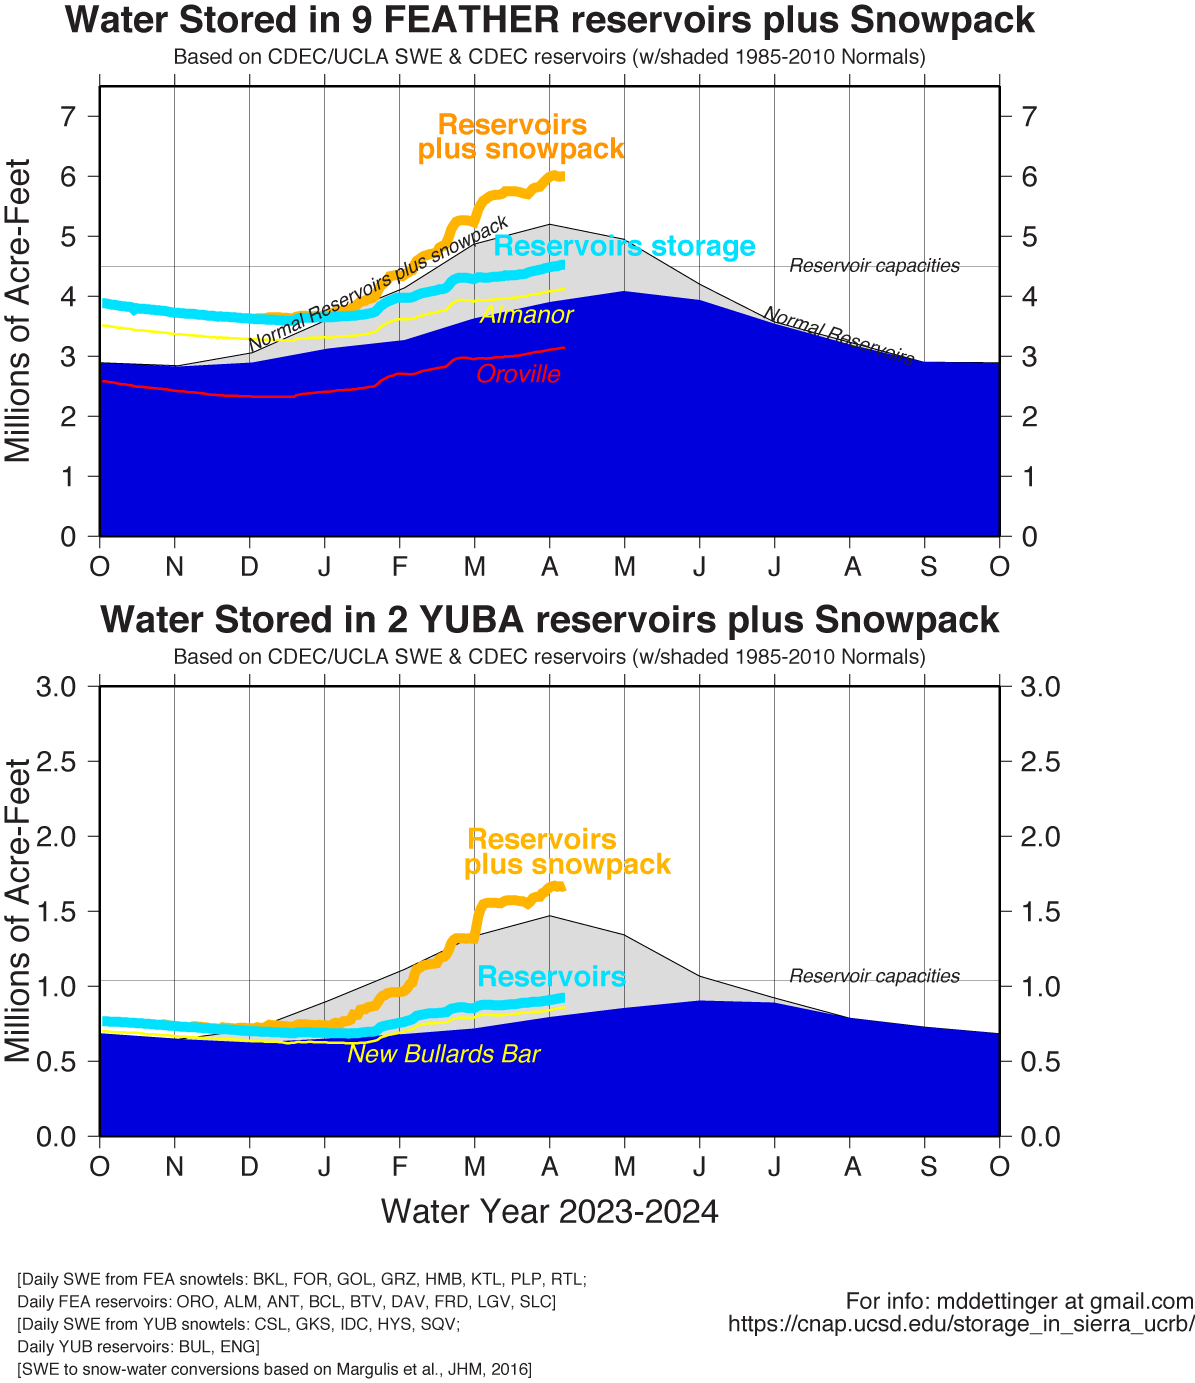
Below are the same observations, except that they have been split out into three subregions to allow for a clearer depiction of where the snowpack storage is, and where the reservoir storage is, within the range.
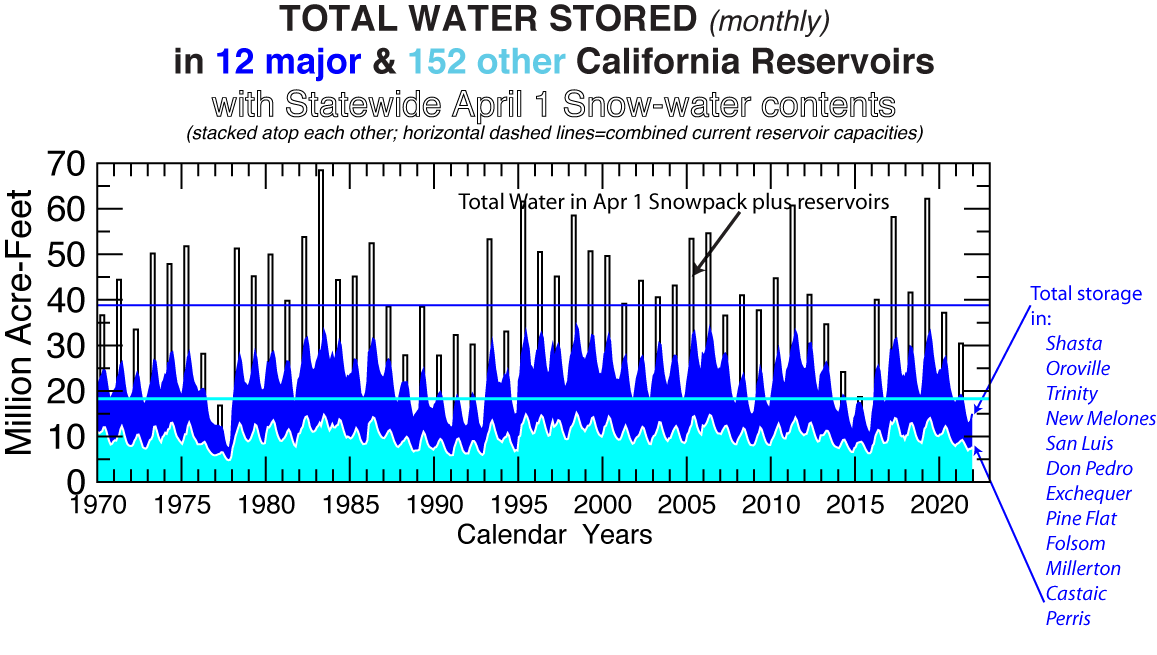
For a longer term and larger scale perspective, the figure below shows the totals of reservoir storage in 12 “major” reservoirs around California (see also here) together with storage in another 152 reservoirs around the state, with April snowpacks. This was the scale orginally discussed by (Dettinger and Anderson, 2015 and allows quick comparison to past droughts.
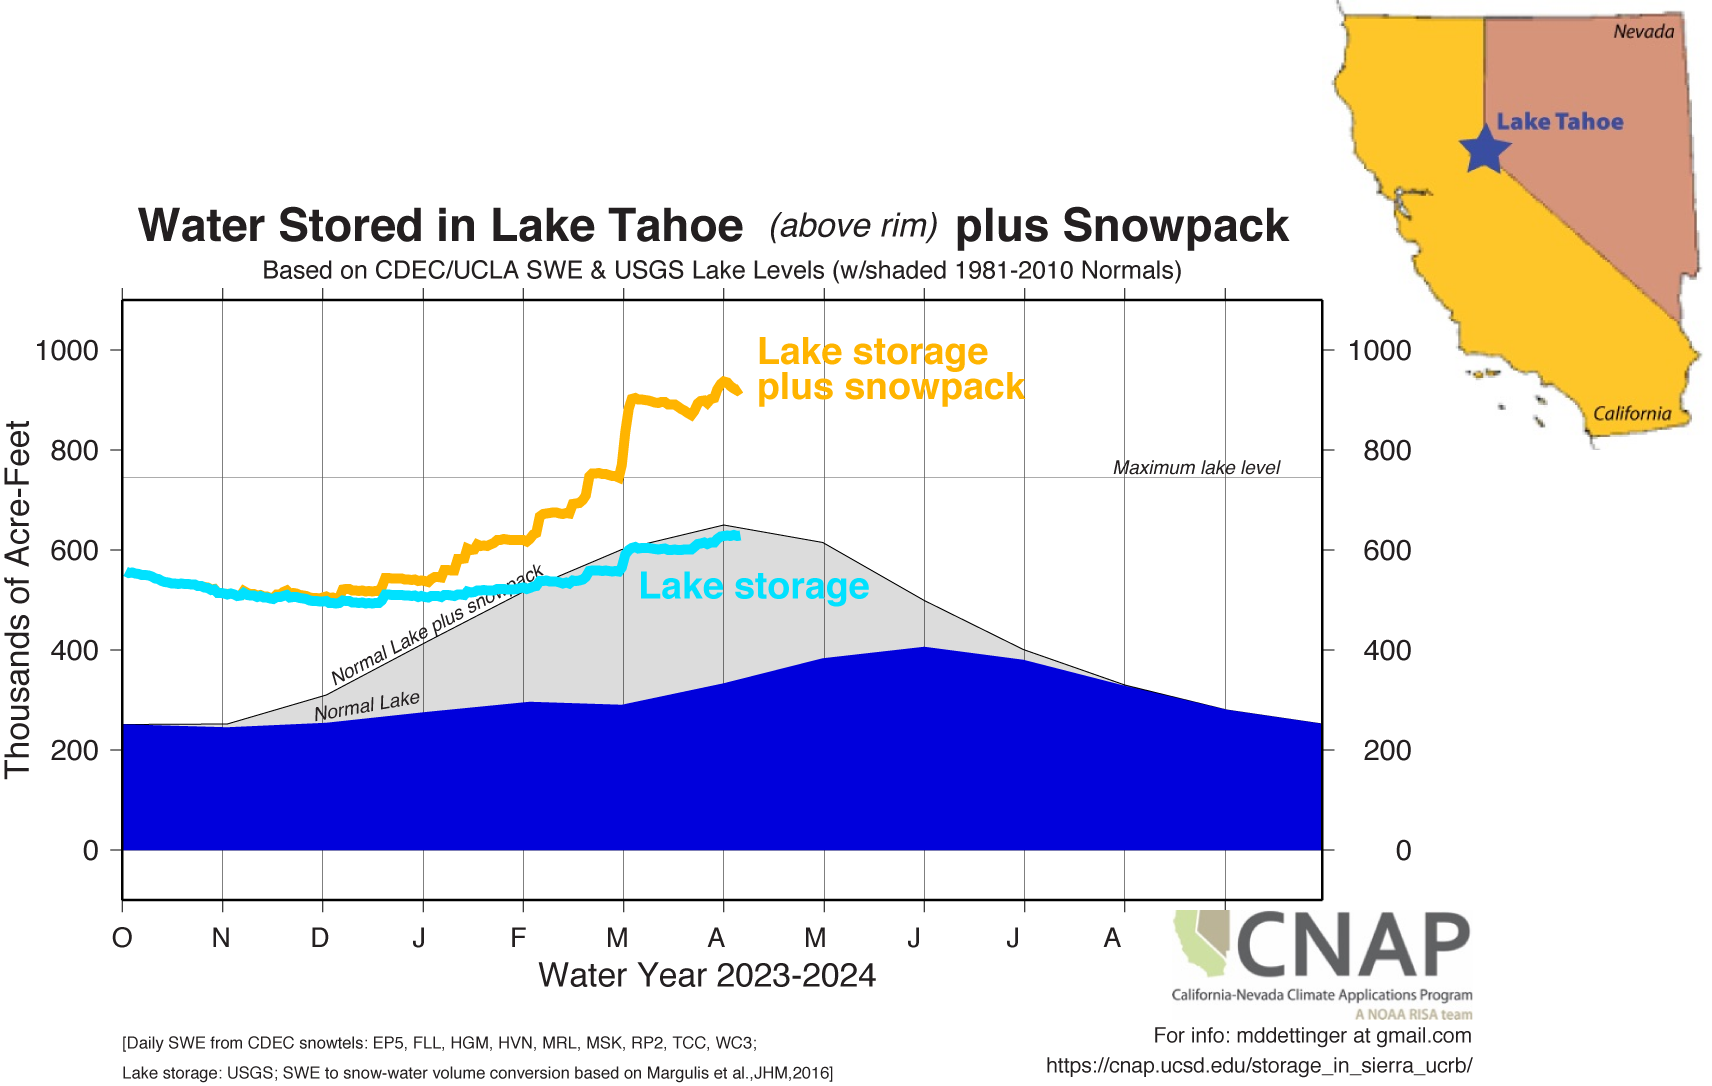
Now, zooming in still further, below are corresponding storage summaries for three important water systems in the north central Sierra Nevada, the Upper Sacramento River drainage, the Yuba-Feather Rivers draining westward north of Interstate 80 and the Lake Tahoe Basin which drains eastward into the Truckee River, Reno, and ultimately Pyramid Lake amd the Carson Sink in northwest Nevada.
Upper Sacramento River Storage
(Updated: 04/05/2024)
See water-years 2020-2023 versions of this graphic here.
Yuba-Feather Rivers Storage
(Updated: 04/05/2024)
See water-years 2020-2023 versions of this graphic here.
Lake Tahoe Basin Storage
(Updated: 04/05/2024)
See water-years 2020-2023 versions of this graphic here.
UPPER COLORADO RIVER BASIN STORAGE
(updated thru 01/09/2024)
A similar, albeit somewhat more complex, set of graphics showing the amount of water stored in 20 long-reporting reservoirs above Lake Powell in the Upper Colorado River Basin (UCRB), in snowpack above Lake Powell, and in Lake Powell, is presented below. Lake
Powell is one of two very large reservoirs–along with Lake Mead–that are used to manage the Colorado River for water users in all seven Southwestern states. Lake Powell storage is considerably greater than the total storage in the 20 reservoirs considered here, and is comparable to the long-term average yearly maximum volume of water stored in the snowpacks of the UCRB. Lake Powell is managed to provide reliable water supplies to all the rivers of the always dry but significantly populated Lower Colorado River Basin.
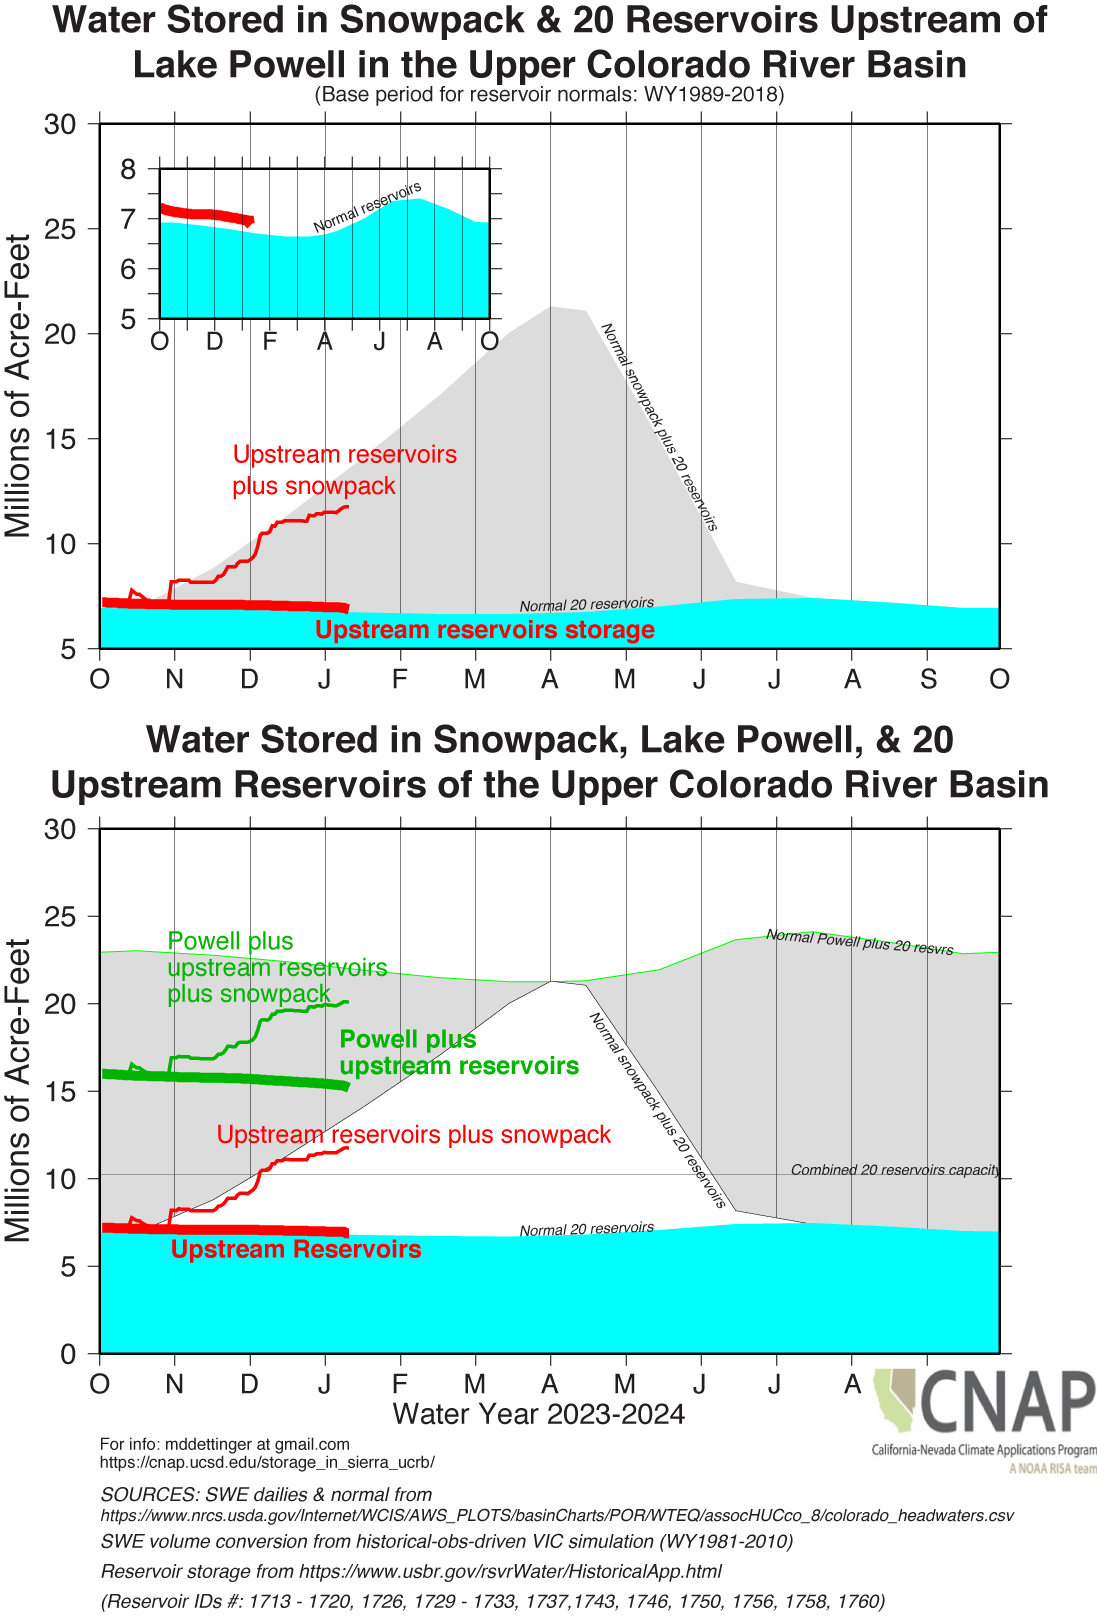
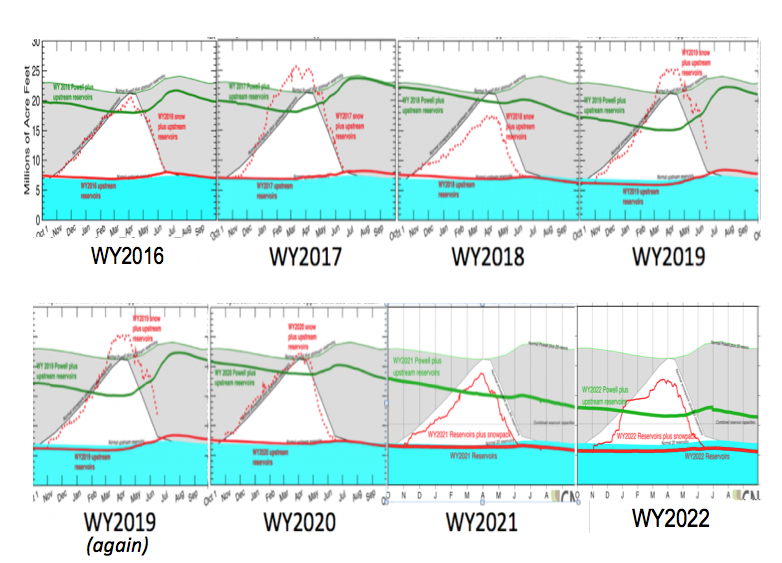
The upper panel of the UCRB graphic compares storage in UCRB reservoirs (above Powell) to long-term norms (inset graphic) and compares storage in UCRB snowpack-plus-reservoirs to their long-term norms. The lower panel compares UCRB reservoirs storage and UCRB snowpack-plus-reservoirs storage to UCRB reservoirs-plus-Lake Powell storage. For comparison to developments this year, the corresponding graphics since water year 2016 are available here.
The following figure is a composite of the bottom frames of these UCRB storage figures for water years 2017-2022. Taken together, the long-term decline in reservoir storages is pretty clear (albeit with occasional rebounds in wet years) with 2022 storage levels reaching their lowest points (historically). But also notice that (1) fluctuations of storage in Lake Powell are generally larger than in the 20 upstream reservoirs, (2) however, in 2021, the upstream reservoirs were drawn down more than in other years, (3) a single BIG-snow year, like 2017 and 2019, can turn the long-term declines around quickly, but only temporarily, especially if the next year is dry, (4) a single normal-snow year, like 2020, doesn’t interrupt the long-term declines much, and (5) indeed, during the normal 2020 year, reservoir storages declined almost back to where they were prior to the wet 2019 “recovery”.