 Climate projections suggest a more variable climate for California and Nevada. Over the last 6 years, the region has experienced extreme droughts to extremely wet years, which may be representative of future climate patterns. California and Nevada are coming off their 2nd wettest and 7th wettest water years (Oct 1st-Sept 30th) in a 122-year record. This extraordinarily wet year followed the modestly wet 2016 (ranked 51st and 28th wettest WYs in CA and NV respectively), and followed the remarkably dry four years 2012-2015 (driest and 29th driest 4-year period in CA and NV respectively). The information below is gathered from multiple websites developed by CNAP researchers and collaborators to provide a summary of the current precipitation and water resources throughout the region. This effort is in partnership with NIDIS (National Integrated Drought Information System) and the CA-NV DEWS which utilizes new and existing partner networks to optimize the expertise of a wide range of federal, tribal, state, local and academic partners in order to make climate and drought science readily available, easily understandable and usable for decision makers; and to improve the capacity of stakeholders to better monitor, forecast, plan for and cope with the impacts of drought.
How much precipitation have we gotten this year? How does it compare to other years?
For more information, please click here. The analysis and figures are courtesy of D. Pierce from Scripps Institution of Oceanography.
San Diego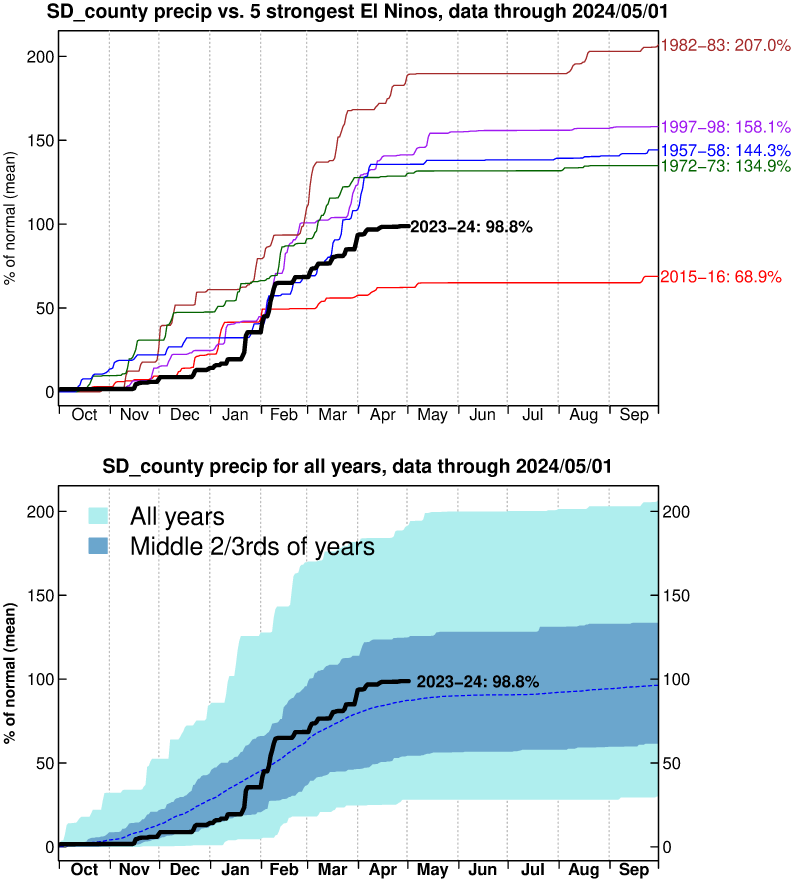 |
Clark County (La Vegas)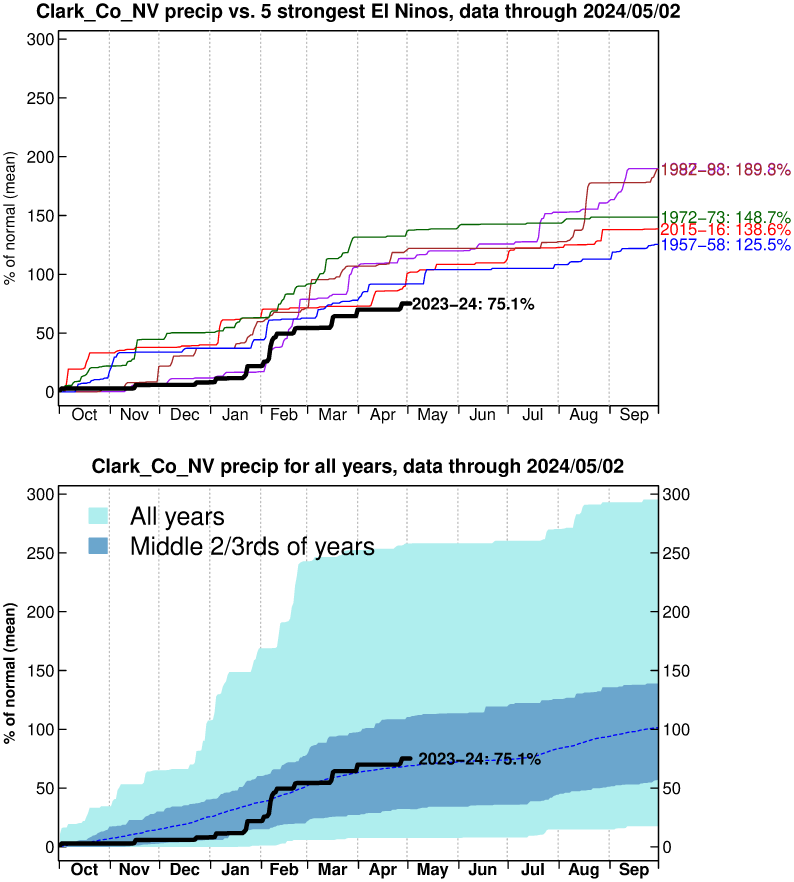 |
8-Station Index (Northern Sierra Nevada)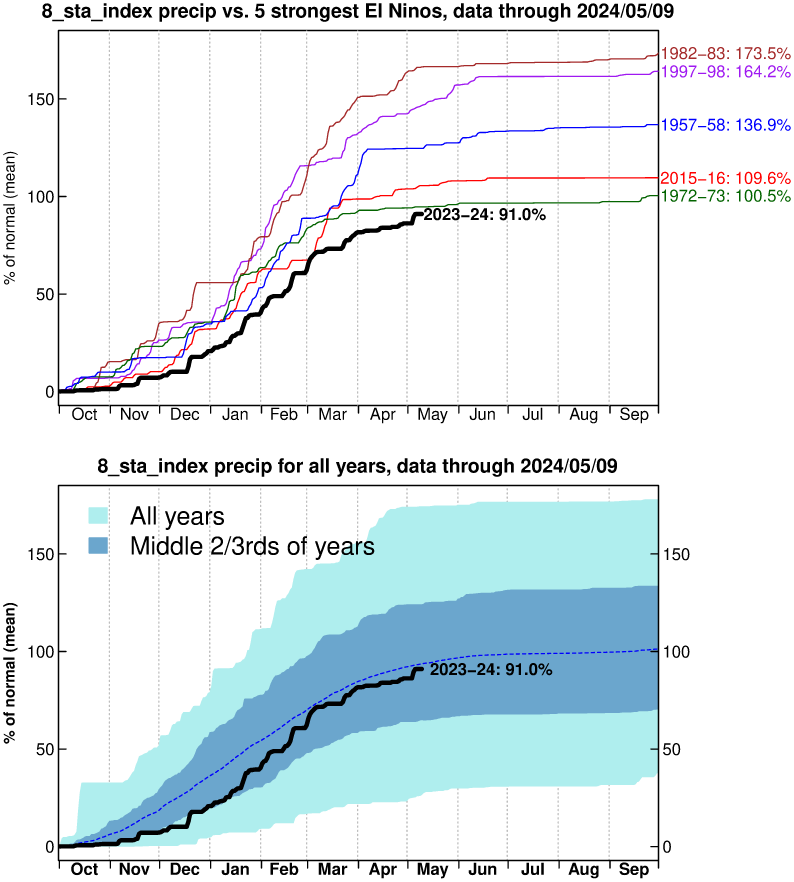 |
Reno/Carson City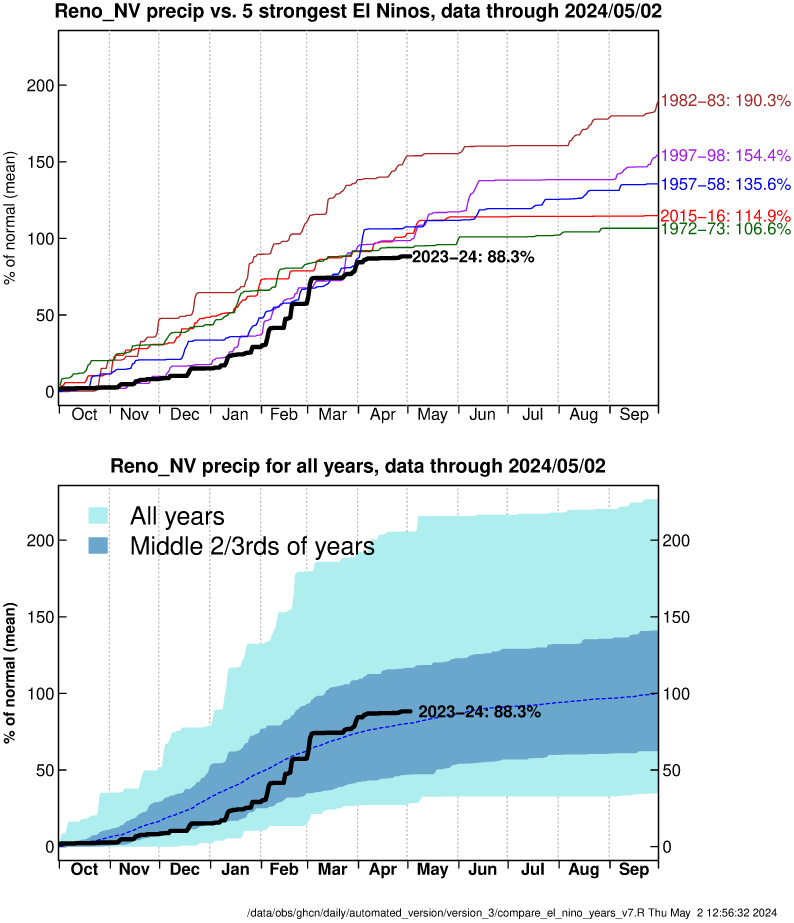 |
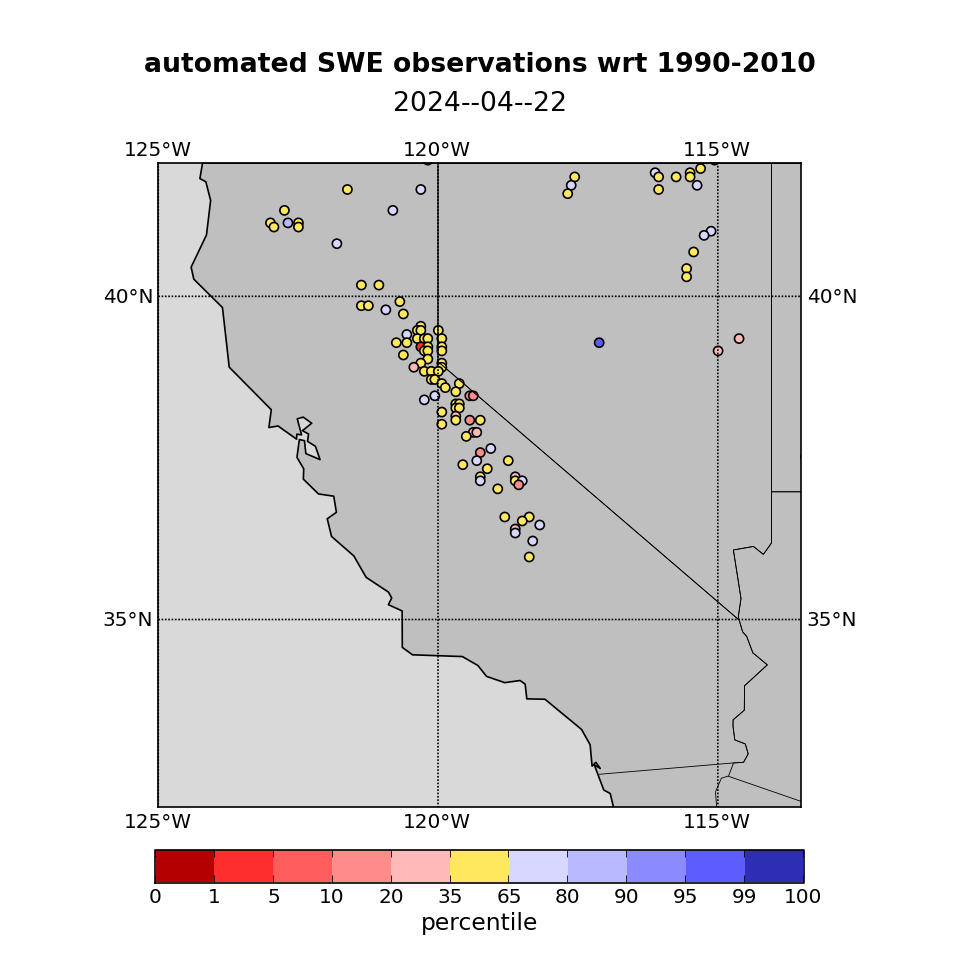
What about Snow Pack?
The figure shows the snow water equivalent (SWE) or the amount of water that is stored in the snow, as a percentile relative to the historical record. The figure on the left is from station observations and the figure on the right is from a hydrology model, specifically VIC, simulation. A 5th% percentile indicates that only 5% of the years had less snow on the specified date than this current year. For more information please click here. The analysis and figure are courtesy of D. Lettenmaier from UCLA.
 |
|
What is the Impact on Water Supply?
The combined water storage in 28 reservoirs and snowpack for California. For more information on Lake Tahoe, Yuba-Feather Watershed, and Upper Colorado please click here. The analysis and figure is courtesy of Michael Dettinger.


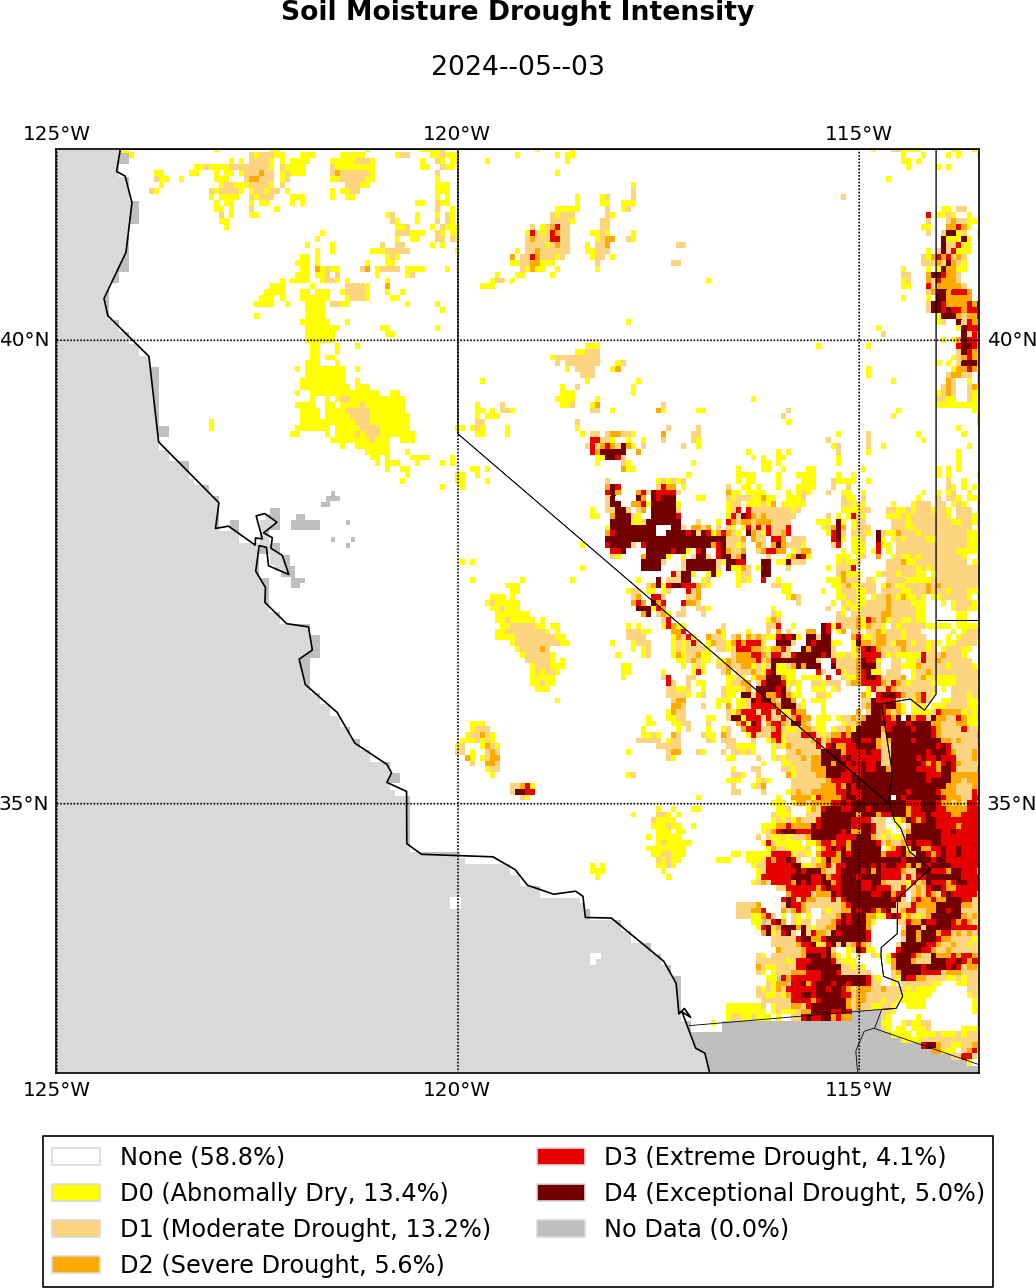
What is the Impact on Soil Moisture?
Modeled soil moisture illustrates how dry this current year is relative to past years. The soil moisture is modeled using the VIC hydrological model run on a daily time step. Also available from UCLA is the modeled soil moisture using the Noah-MP model. For more information please click here. The analysis and figure are courtesy of Dennis Lettenmaier from UCLA.
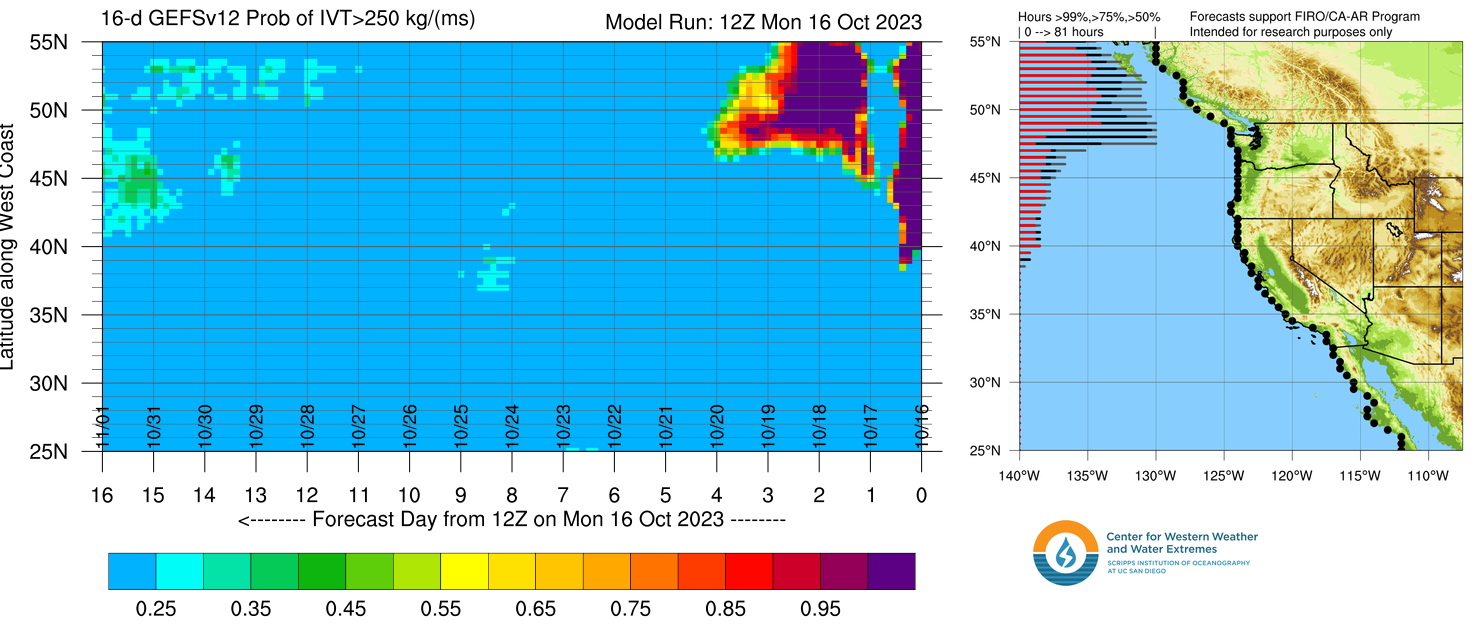
Is there any rain on the horizon?
The figures show the NCEP Global Forecast System (GFS) Model 7-day total precipitation forecast. For more information please click here. The figure is courtesy of CW3E, a CNAP collaborator.

CNAP collaborator, CW3E, focuses on research and forecasts of atmospheric rivers (ARs). ARs often provide beneficial rainfall to the US west coast, but if they stall or are extreme in strength they can cause flooding. The figure below shows the probability of an AR hitting the US west-coast based on the US National Weather forecast model, GFS ensemble. The figure was developed by CW3E Director, Marty Ralph, and Jason Cordeira at Plymouth State University. To see more information please visit the CW3E website.